Chickasaw vs Central American Indian Female Poverty Among 18-24 Year Olds
COMPARE
Chickasaw
Central American Indian
Female Poverty Among 18-24 Year Olds
Female Poverty Among 18-24 Year Olds Comparison
Chickasaw
Central American Indians
24.5%
FEMALE POVERTY AMONG 18-24 YEAR OLDS
0.0/ 100
METRIC RATING
318th/ 347
METRIC RANK
22.6%
FEMALE POVERTY AMONG 18-24 YEAR OLDS
0.0/ 100
METRIC RATING
298th/ 347
METRIC RANK
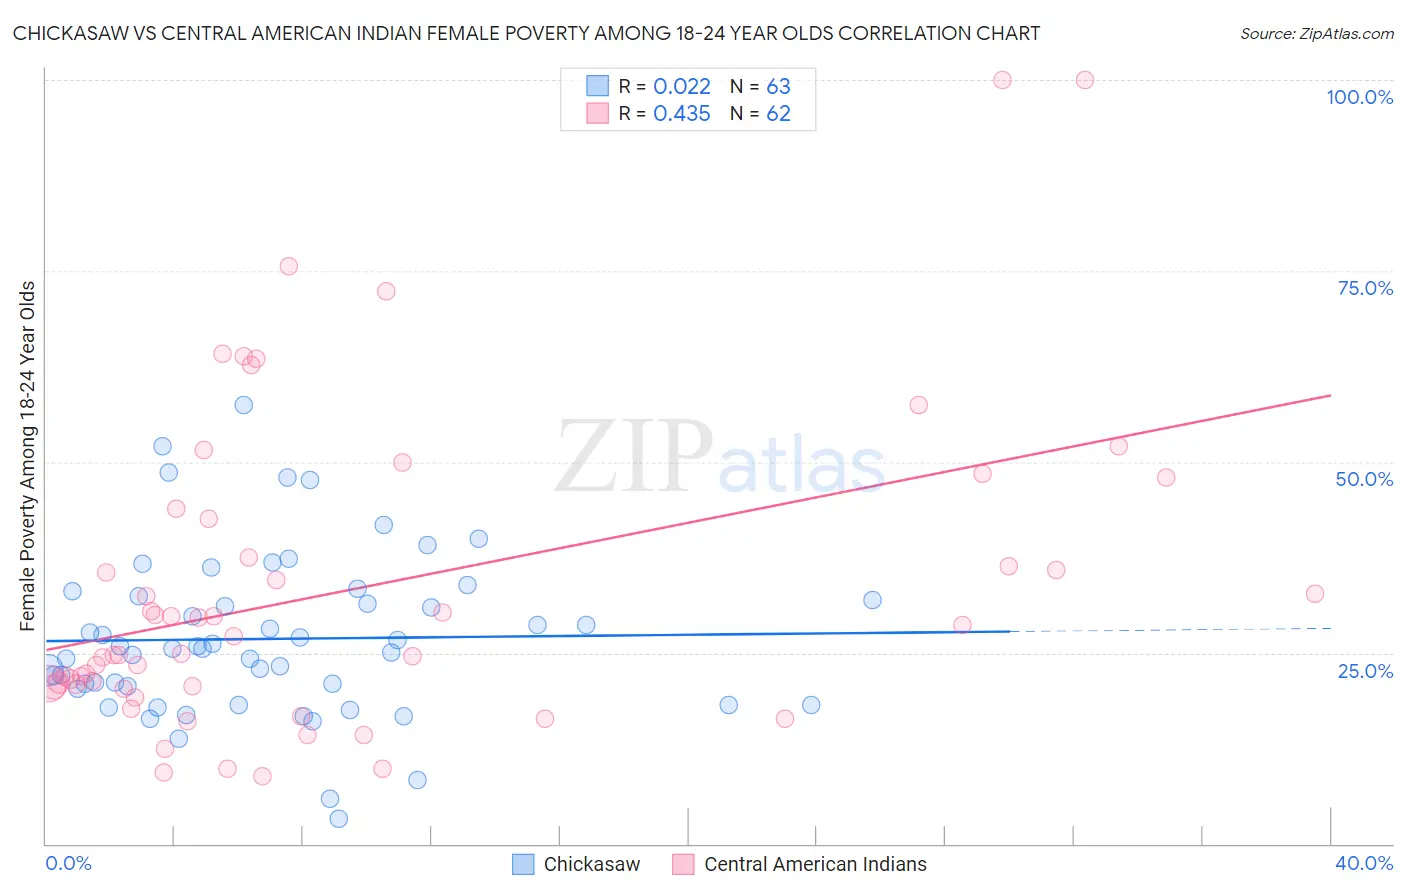
Chickasaw vs Central American Indian Female Poverty Among 18-24 Year Olds Correlation Chart
The statistical analysis conducted on geographies consisting of 146,361,358 people shows no correlation between the proportion of Chickasaw and poverty level among females between the ages 18 and 24 in the United States with a correlation coefficient (R) of 0.022 and weighted average of 24.5%. Similarly, the statistical analysis conducted on geographies consisting of 322,009,816 people shows a moderate positive correlation between the proportion of Central American Indians and poverty level among females between the ages 18 and 24 in the United States with a correlation coefficient (R) of 0.435 and weighted average of 22.6%, a difference of 8.4%.
Female Poverty Among 18-24 Year Olds Correlation Summary
| Measurement | Chickasaw | Central American Indian |
| Minimum | 3.3% | 8.8% |
| Maximum | 57.4% | 100.0% |
| Range | 54.1% | 91.2% |
| Mean | 26.8% | 33.2% |
| Median | 25.6% | 26.0% |
| Interquartile 25% (IQ1) | 20.4% | 20.6% |
| Interquartile 75% (IQ3) | 32.3% | 42.6% |
| Interquartile Range (IQR) | 12.0% | 22.0% |
| Standard Deviation (Sample) | 10.6% | 20.4% |
| Standard Deviation (Population) | 10.5% | 20.3% |
Demographics Similar to Chickasaw and Central American Indians by Female Poverty Among 18-24 Year Olds
In terms of female poverty among 18-24 year olds, the demographic groups most similar to Chickasaw are Osage (24.5%, a difference of 0.090%), Alsatian (24.4%, a difference of 0.38%), Black/African American (24.3%, a difference of 0.69%), Choctaw (24.3%, a difference of 0.89%), and Creek (24.2%, a difference of 1.1%). Similarly, the demographic groups most similar to Central American Indians are Cherokee (22.7%, a difference of 0.41%), African (22.8%, a difference of 1.1%), Seminole (22.9%, a difference of 1.2%), Iroquois (22.9%, a difference of 1.6%), and Senegalese (23.0%, a difference of 1.8%).
| Demographics | Rating | Rank | Female Poverty Among 18-24 Year Olds |
| Central American Indians | 0.0 /100 | #298 | Tragic 22.6% |
| Cherokee | 0.0 /100 | #299 | Tragic 22.7% |
| Africans | 0.0 /100 | #300 | Tragic 22.8% |
| Seminole | 0.0 /100 | #301 | Tragic 22.9% |
| Iroquois | 0.0 /100 | #302 | Tragic 22.9% |
| Senegalese | 0.0 /100 | #303 | Tragic 23.0% |
| Sudanese | 0.0 /100 | #304 | Tragic 23.0% |
| Immigrants | Kuwait | 0.0 /100 | #305 | Tragic 23.0% |
| Paiute | 0.0 /100 | #306 | Tragic 23.3% |
| Cree | 0.0 /100 | #307 | Tragic 23.4% |
| Immigrants | Sudan | 0.0 /100 | #308 | Tragic 23.5% |
| Blackfeet | 0.0 /100 | #309 | Tragic 23.6% |
| Comanche | 0.0 /100 | #310 | Tragic 23.6% |
| Potawatomi | 0.0 /100 | #311 | Tragic 23.7% |
| Yuman | 0.0 /100 | #312 | Tragic 24.0% |
| Creek | 0.0 /100 | #313 | Tragic 24.2% |
| Choctaw | 0.0 /100 | #314 | Tragic 24.3% |
| Blacks/African Americans | 0.0 /100 | #315 | Tragic 24.3% |
| Alsatians | 0.0 /100 | #316 | Tragic 24.4% |
| Osage | 0.0 /100 | #317 | Tragic 24.5% |
| Chickasaw | 0.0 /100 | #318 | Tragic 24.5% |