Syrian vs Central American Indian Currently Married
COMPARE
Syrian
Central American Indian
Currently Married
Currently Married Comparison
Syrians
Central American Indians
47.5%
CURRENTLY MARRIED
88.9/ 100
METRIC RATING
120th/ 347
METRIC RANK
43.3%
CURRENTLY MARRIED
0.0/ 100
METRIC RATING
279th/ 347
METRIC RANK
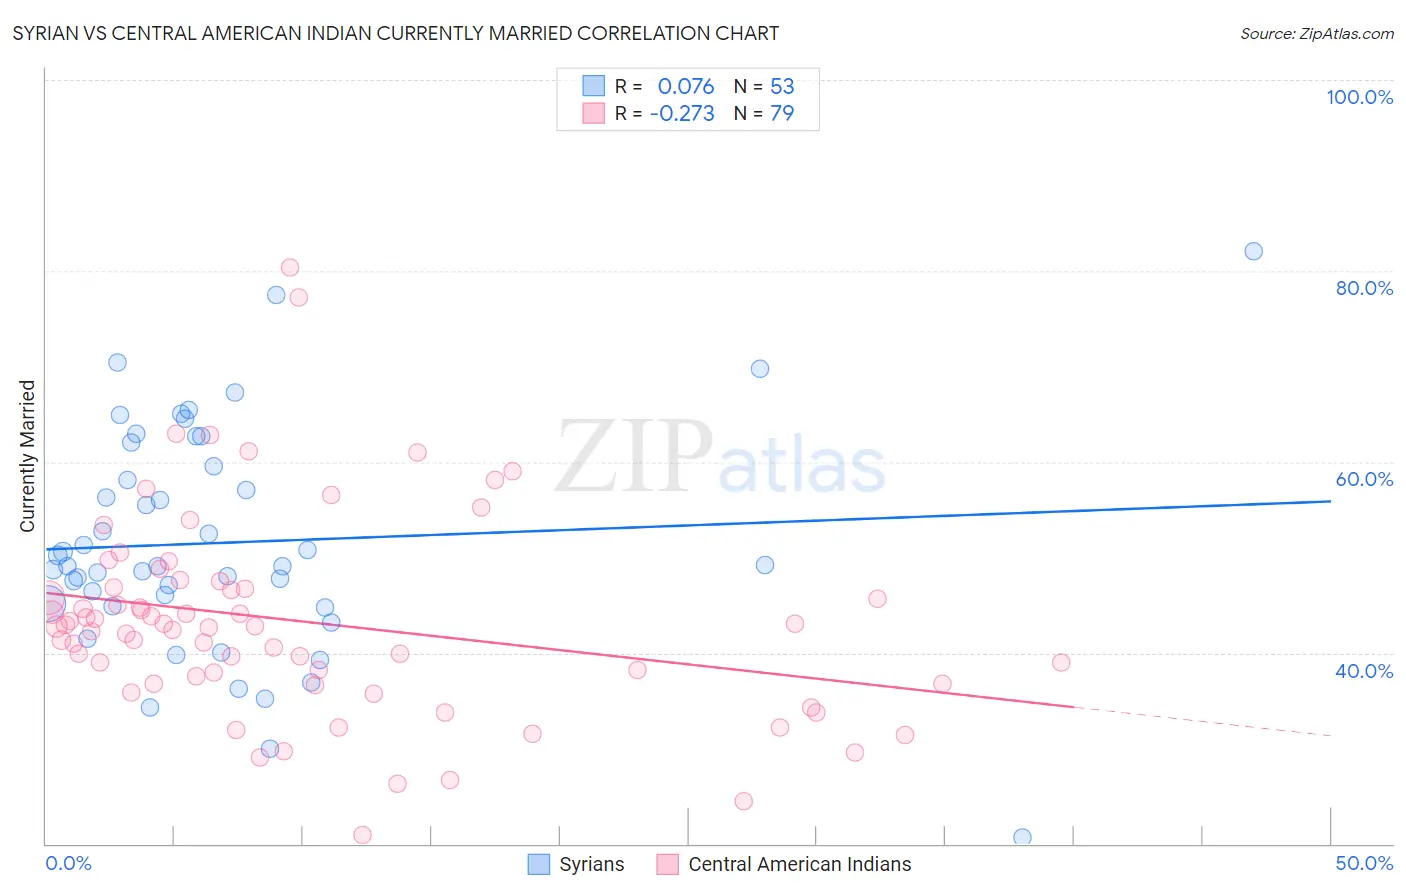
Syrian vs Central American Indian Currently Married Correlation Chart
The statistical analysis conducted on geographies consisting of 266,298,061 people shows a slight positive correlation between the proportion of Syrians and percentage of population currently married in the United States with a correlation coefficient (R) of 0.076 and weighted average of 47.5%. Similarly, the statistical analysis conducted on geographies consisting of 326,134,160 people shows a weak negative correlation between the proportion of Central American Indians and percentage of population currently married in the United States with a correlation coefficient (R) of -0.273 and weighted average of 43.3%, a difference of 9.8%.
Currently Married Correlation Summary
| Measurement | Syrian | Central American Indian |
| Minimum | 20.6% | 20.9% |
| Maximum | 82.1% | 80.4% |
| Range | 61.5% | 59.5% |
| Mean | 51.6% | 43.3% |
| Median | 49.1% | 42.8% |
| Interquartile 25% (IQ1) | 45.0% | 36.8% |
| Interquartile 75% (IQ3) | 60.8% | 46.8% |
| Interquartile Range (IQR) | 15.7% | 10.0% |
| Standard Deviation (Sample) | 11.8% | 10.6% |
| Standard Deviation (Population) | 11.7% | 10.5% |
Similar Demographics by Currently Married
Demographics Similar to Syrians by Currently Married
In terms of currently married, the demographic groups most similar to Syrians are Immigrants from Croatia (47.5%, a difference of 0.030%), Osage (47.5%, a difference of 0.090%), Immigrants from Philippines (47.6%, a difference of 0.12%), Australian (47.6%, a difference of 0.12%), and Puget Sound Salish (47.6%, a difference of 0.13%).
| Demographics | Rating | Rank | Currently Married |
| Immigrants | Denmark | 90.9 /100 | #113 | Exceptional 47.6% |
| South Africans | 90.5 /100 | #114 | Exceptional 47.6% |
| Immigrants | Indonesia | 90.5 /100 | #115 | Exceptional 47.6% |
| Palestinians | 90.4 /100 | #116 | Exceptional 47.6% |
| Puget Sound Salish | 90.3 /100 | #117 | Exceptional 47.6% |
| Immigrants | Philippines | 90.2 /100 | #118 | Exceptional 47.6% |
| Australians | 90.2 /100 | #119 | Exceptional 47.6% |
| Syrians | 88.9 /100 | #120 | Excellent 47.5% |
| Immigrants | Croatia | 88.6 /100 | #121 | Excellent 47.5% |
| Osage | 87.9 /100 | #122 | Excellent 47.5% |
| Immigrants | Kazakhstan | 87.2 /100 | #123 | Excellent 47.4% |
| Laotians | 86.6 /100 | #124 | Excellent 47.4% |
| Okinawans | 85.3 /100 | #125 | Excellent 47.4% |
| Immigrants | Jordan | 84.9 /100 | #126 | Excellent 47.4% |
| New Zealanders | 84.9 /100 | #127 | Excellent 47.4% |
Demographics Similar to Central American Indians by Currently Married
In terms of currently married, the demographic groups most similar to Central American Indians are Apache (43.2%, a difference of 0.080%), Chippewa (43.2%, a difference of 0.080%), Central American (43.3%, a difference of 0.15%), Immigrants from Ecuador (43.2%, a difference of 0.16%), and Kiowa (43.2%, a difference of 0.27%).
| Demographics | Rating | Rank | Currently Married |
| Indonesians | 0.1 /100 | #272 | Tragic 43.5% |
| Yaqui | 0.1 /100 | #273 | Tragic 43.4% |
| Nigerians | 0.1 /100 | #274 | Tragic 43.4% |
| Colville | 0.1 /100 | #275 | Tragic 43.4% |
| Sierra Leoneans | 0.1 /100 | #276 | Tragic 43.4% |
| Immigrants | Nigeria | 0.1 /100 | #277 | Tragic 43.4% |
| Central Americans | 0.0 /100 | #278 | Tragic 43.3% |
| Central American Indians | 0.0 /100 | #279 | Tragic 43.3% |
| Apache | 0.0 /100 | #280 | Tragic 43.2% |
| Chippewa | 0.0 /100 | #281 | Tragic 43.2% |
| Immigrants | Ecuador | 0.0 /100 | #282 | Tragic 43.2% |
| Kiowa | 0.0 /100 | #283 | Tragic 43.2% |
| Immigrants | El Salvador | 0.0 /100 | #284 | Tragic 43.1% |
| Immigrants | Middle Africa | 0.0 /100 | #285 | Tragic 43.0% |
| Ghanaians | 0.0 /100 | #286 | Tragic 42.9% |