Chickasaw vs Central American Indian Seniors Poverty Over the Age of 65
COMPARE
Chickasaw
Central American Indian
Seniors Poverty Over the Age of 65
Seniors Poverty Over the Age of 65 Comparison
Chickasaw
Central American Indians
10.7%
SENIORS POVERTY OVER THE AGE OF 65
73.6/ 100
METRIC RATING
155th/ 347
METRIC RANK
15.1%
SENIORS POVERTY OVER THE AGE OF 65
0.0/ 100
METRIC RATING
325th/ 347
METRIC RANK
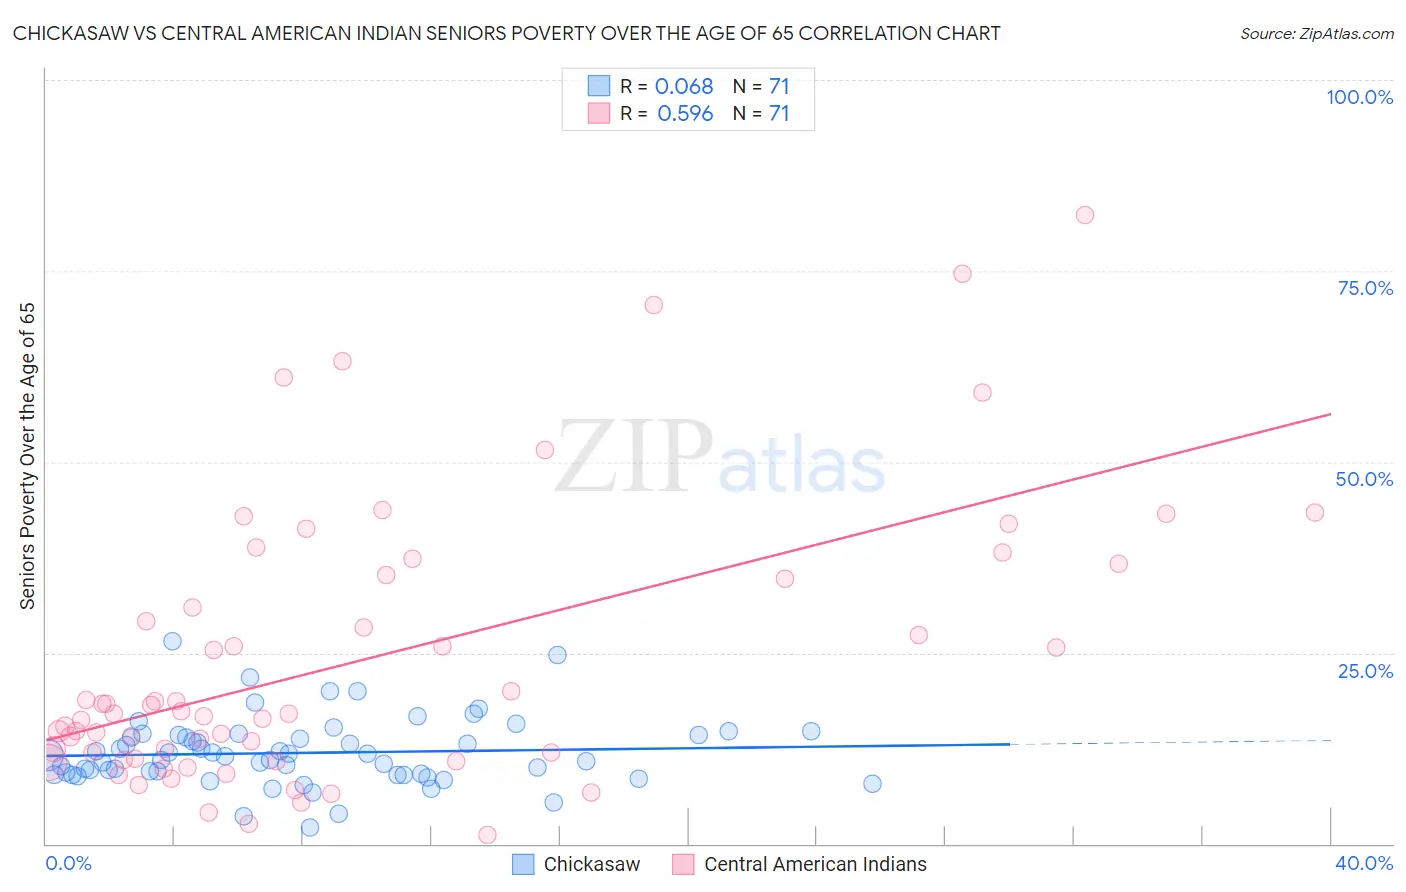
Chickasaw vs Central American Indian Seniors Poverty Over the Age of 65 Correlation Chart
The statistical analysis conducted on geographies consisting of 147,403,073 people shows a slight positive correlation between the proportion of Chickasaw and poverty level among seniors over the age of 65 in the United States with a correlation coefficient (R) of 0.068 and weighted average of 10.7%. Similarly, the statistical analysis conducted on geographies consisting of 325,391,809 people shows a substantial positive correlation between the proportion of Central American Indians and poverty level among seniors over the age of 65 in the United States with a correlation coefficient (R) of 0.596 and weighted average of 15.1%, a difference of 41.2%.
Seniors Poverty Over the Age of 65 Correlation Summary
| Measurement | Chickasaw | Central American Indian |
| Minimum | 2.1% | 1.1% |
| Maximum | 26.4% | 82.2% |
| Range | 24.4% | 81.1% |
| Mean | 11.9% | 24.1% |
| Median | 11.5% | 17.1% |
| Interquartile 25% (IQ1) | 9.1% | 11.2% |
| Interquartile 75% (IQ3) | 14.2% | 35.2% |
| Interquartile Range (IQR) | 5.1% | 24.1% |
| Standard Deviation (Sample) | 4.4% | 18.1% |
| Standard Deviation (Population) | 4.4% | 18.0% |
Similar Demographics by Seniors Poverty Over the Age of 65
Demographics Similar to Chickasaw by Seniors Poverty Over the Age of 65
In terms of seniors poverty over the age of 65, the demographic groups most similar to Chickasaw are Ethiopian (10.7%, a difference of 0.070%), Immigrants from Ethiopia (10.7%, a difference of 0.080%), Immigrants from Saudi Arabia (10.7%, a difference of 0.16%), Immigrants from Sierra Leone (10.7%, a difference of 0.22%), and Fijian (10.7%, a difference of 0.24%).
| Demographics | Rating | Rank | Seniors Poverty Over the Age of 65 |
| Americans | 78.1 /100 | #148 | Good 10.6% |
| Immigrants | Cameroon | 78.1 /100 | #149 | Good 10.6% |
| Immigrants | Switzerland | 77.3 /100 | #150 | Good 10.6% |
| Spanish | 76.8 /100 | #151 | Good 10.6% |
| Immigrants | Egypt | 76.5 /100 | #152 | Good 10.6% |
| Fijians | 75.6 /100 | #153 | Good 10.7% |
| Immigrants | Saudi Arabia | 74.9 /100 | #154 | Good 10.7% |
| Chickasaw | 73.6 /100 | #155 | Good 10.7% |
| Ethiopians | 72.9 /100 | #156 | Good 10.7% |
| Immigrants | Ethiopia | 72.9 /100 | #157 | Good 10.7% |
| Immigrants | Sierra Leone | 71.7 /100 | #158 | Good 10.7% |
| Immigrants | Micronesia | 70.8 /100 | #159 | Good 10.7% |
| Sudanese | 68.2 /100 | #160 | Good 10.7% |
| Arabs | 65.2 /100 | #161 | Good 10.8% |
| Immigrants | Indonesia | 64.8 /100 | #162 | Good 10.8% |
Demographics Similar to Central American Indians by Seniors Poverty Over the Age of 65
In terms of seniors poverty over the age of 65, the demographic groups most similar to Central American Indians are Nicaraguan (15.0%, a difference of 0.59%), Immigrants from Armenia (15.2%, a difference of 0.60%), Crow (15.2%, a difference of 0.86%), Sioux (15.3%, a difference of 1.4%), and Yakama (14.8%, a difference of 2.0%).
| Demographics | Rating | Rank | Seniors Poverty Over the Age of 65 |
| Immigrants | Honduras | 0.0 /100 | #318 | Tragic 14.5% |
| Cape Verdeans | 0.0 /100 | #319 | Tragic 14.7% |
| Immigrants | Haiti | 0.0 /100 | #320 | Tragic 14.7% |
| Houma | 0.0 /100 | #321 | Tragic 14.7% |
| Immigrants | Barbados | 0.0 /100 | #322 | Tragic 14.8% |
| Yakama | 0.0 /100 | #323 | Tragic 14.8% |
| Nicaraguans | 0.0 /100 | #324 | Tragic 15.0% |
| Central American Indians | 0.0 /100 | #325 | Tragic 15.1% |
| Immigrants | Armenia | 0.0 /100 | #326 | Tragic 15.2% |
| Crow | 0.0 /100 | #327 | Tragic 15.2% |
| Sioux | 0.0 /100 | #328 | Tragic 15.3% |
| Immigrants | Dominica | 0.0 /100 | #329 | Tragic 15.5% |
| Immigrants | St. Vincent and the Grenadines | 0.0 /100 | #330 | Tragic 15.5% |
| British West Indians | 0.0 /100 | #331 | Tragic 15.6% |
| Immigrants | Grenada | 0.0 /100 | #332 | Tragic 15.8% |