Black/African American vs Hispanic or Latino Family Households with Children
COMPARE
Black/African American
Hispanic or Latino
Family Households with Children
Family Households with Children Comparison
Blacks/African Americans
Hispanics or Latinos
26.5%
FAMILY HOUSEHOLDS WITH CHILDREN
0.1/ 100
METRIC RATING
293rd/ 347
METRIC RANK
29.9%
FAMILY HOUSEHOLDS WITH CHILDREN
100.0/ 100
METRIC RATING
17th/ 347
METRIC RANK
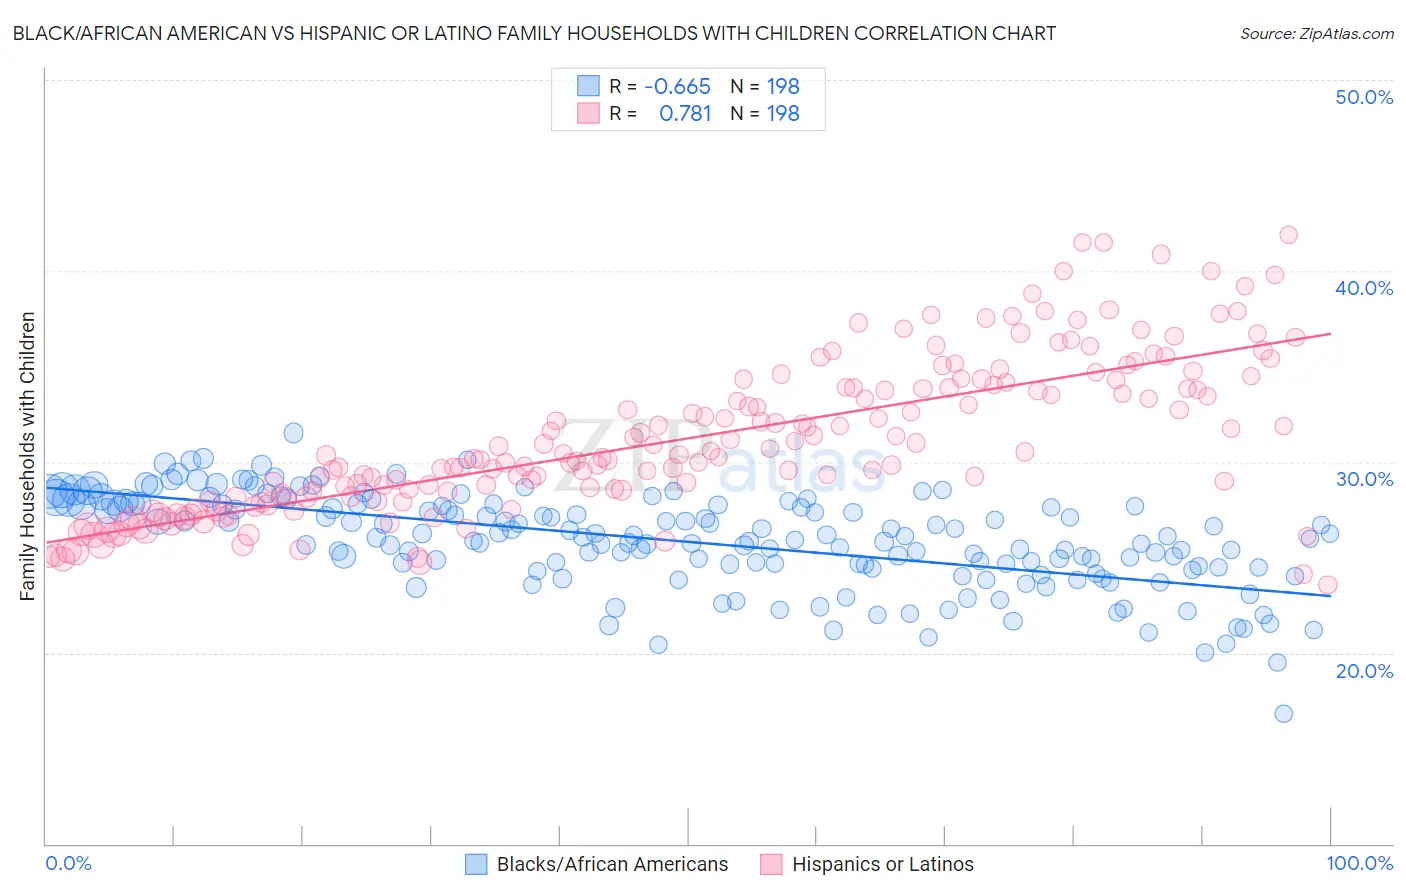
Black/African American vs Hispanic or Latino Family Households with Children Correlation Chart
The statistical analysis conducted on geographies consisting of 564,937,994 people shows a significant negative correlation between the proportion of Blacks/African Americans and percentage of family households with children in the United States with a correlation coefficient (R) of -0.665 and weighted average of 26.5%. Similarly, the statistical analysis conducted on geographies consisting of 574,333,059 people shows a strong positive correlation between the proportion of Hispanics or Latinos and percentage of family households with children in the United States with a correlation coefficient (R) of 0.781 and weighted average of 29.9%, a difference of 13.1%.
Family Households with Children Correlation Summary
| Measurement | Black/African American | Hispanic or Latino |
| Minimum | 16.8% | 23.6% |
| Maximum | 31.5% | 41.9% |
| Range | 14.7% | 18.3% |
| Mean | 25.8% | 31.2% |
| Median | 26.0% | 30.3% |
| Interquartile 25% (IQ1) | 24.5% | 28.2% |
| Interquartile 75% (IQ3) | 27.7% | 33.9% |
| Interquartile Range (IQR) | 3.2% | 5.8% |
| Standard Deviation (Sample) | 2.5% | 4.0% |
| Standard Deviation (Population) | 2.4% | 4.0% |
Similar Demographics by Family Households with Children
Demographics Similar to Blacks/African Americans by Family Households with Children
In terms of family households with children, the demographic groups most similar to Blacks/African Americans are Polish (26.5%, a difference of 0.050%), Albanian (26.5%, a difference of 0.060%), Bahamian (26.5%, a difference of 0.060%), Latvian (26.4%, a difference of 0.060%), and Macedonian (26.4%, a difference of 0.13%).
| Demographics | Rating | Rank | Family Households with Children |
| Immigrants | Senegal | 0.2 /100 | #286 | Tragic 26.5% |
| Shoshone | 0.2 /100 | #287 | Tragic 26.5% |
| Russians | 0.2 /100 | #288 | Tragic 26.5% |
| Immigrants | Sweden | 0.2 /100 | #289 | Tragic 26.5% |
| Albanians | 0.2 /100 | #290 | Tragic 26.5% |
| Bahamians | 0.2 /100 | #291 | Tragic 26.5% |
| Poles | 0.2 /100 | #292 | Tragic 26.5% |
| Blacks/African Americans | 0.1 /100 | #293 | Tragic 26.5% |
| Latvians | 0.1 /100 | #294 | Tragic 26.4% |
| Macedonians | 0.1 /100 | #295 | Tragic 26.4% |
| Croatians | 0.1 /100 | #296 | Tragic 26.4% |
| Armenians | 0.1 /100 | #297 | Tragic 26.4% |
| Immigrants | Western Europe | 0.1 /100 | #298 | Tragic 26.4% |
| Trinidadians and Tobagonians | 0.1 /100 | #299 | Tragic 26.4% |
| Paiute | 0.1 /100 | #300 | Tragic 26.4% |
Demographics Similar to Hispanics or Latinos by Family Households with Children
In terms of family households with children, the demographic groups most similar to Hispanics or Latinos are Salvadoran (29.9%, a difference of 0.19%), Alaska Native (29.9%, a difference of 0.22%), Immigrants from El Salvador (29.8%, a difference of 0.25%), Immigrants from Laos (29.8%, a difference of 0.30%), and Malaysian (29.8%, a difference of 0.33%).
| Demographics | Rating | Rank | Family Households with Children |
| Immigrants | Fiji | 100.0 /100 | #10 | Exceptional 30.5% |
| Nepalese | 100.0 /100 | #11 | Exceptional 30.5% |
| Immigrants | Pakistan | 100.0 /100 | #12 | Exceptional 30.2% |
| Afghans | 100.0 /100 | #13 | Exceptional 30.2% |
| Bangladeshis | 100.0 /100 | #14 | Exceptional 30.1% |
| Immigrants | South Central Asia | 100.0 /100 | #15 | Exceptional 30.0% |
| Immigrants | Afghanistan | 100.0 /100 | #16 | Exceptional 30.0% |
| Hispanics or Latinos | 100.0 /100 | #17 | Exceptional 29.9% |
| Salvadorans | 100.0 /100 | #18 | Exceptional 29.9% |
| Alaska Natives | 100.0 /100 | #19 | Exceptional 29.9% |
| Immigrants | El Salvador | 100.0 /100 | #20 | Exceptional 29.8% |
| Immigrants | Laos | 100.0 /100 | #21 | Exceptional 29.8% |
| Malaysians | 100.0 /100 | #22 | Exceptional 29.8% |
| Mexican American Indians | 100.0 /100 | #23 | Exceptional 29.7% |
| Guamanians/Chamorros | 100.0 /100 | #24 | Exceptional 29.7% |