Black/African American vs Creek Family Households with Children
COMPARE
Black/African American
Creek
Family Households with Children
Family Households with Children Comparison
Blacks/African Americans
Creek
26.5%
FAMILY HOUSEHOLDS WITH CHILDREN
0.1/ 100
METRIC RATING
293rd/ 347
METRIC RANK
27.4%
FAMILY HOUSEHOLDS WITH CHILDREN
39.8/ 100
METRIC RATING
187th/ 347
METRIC RANK
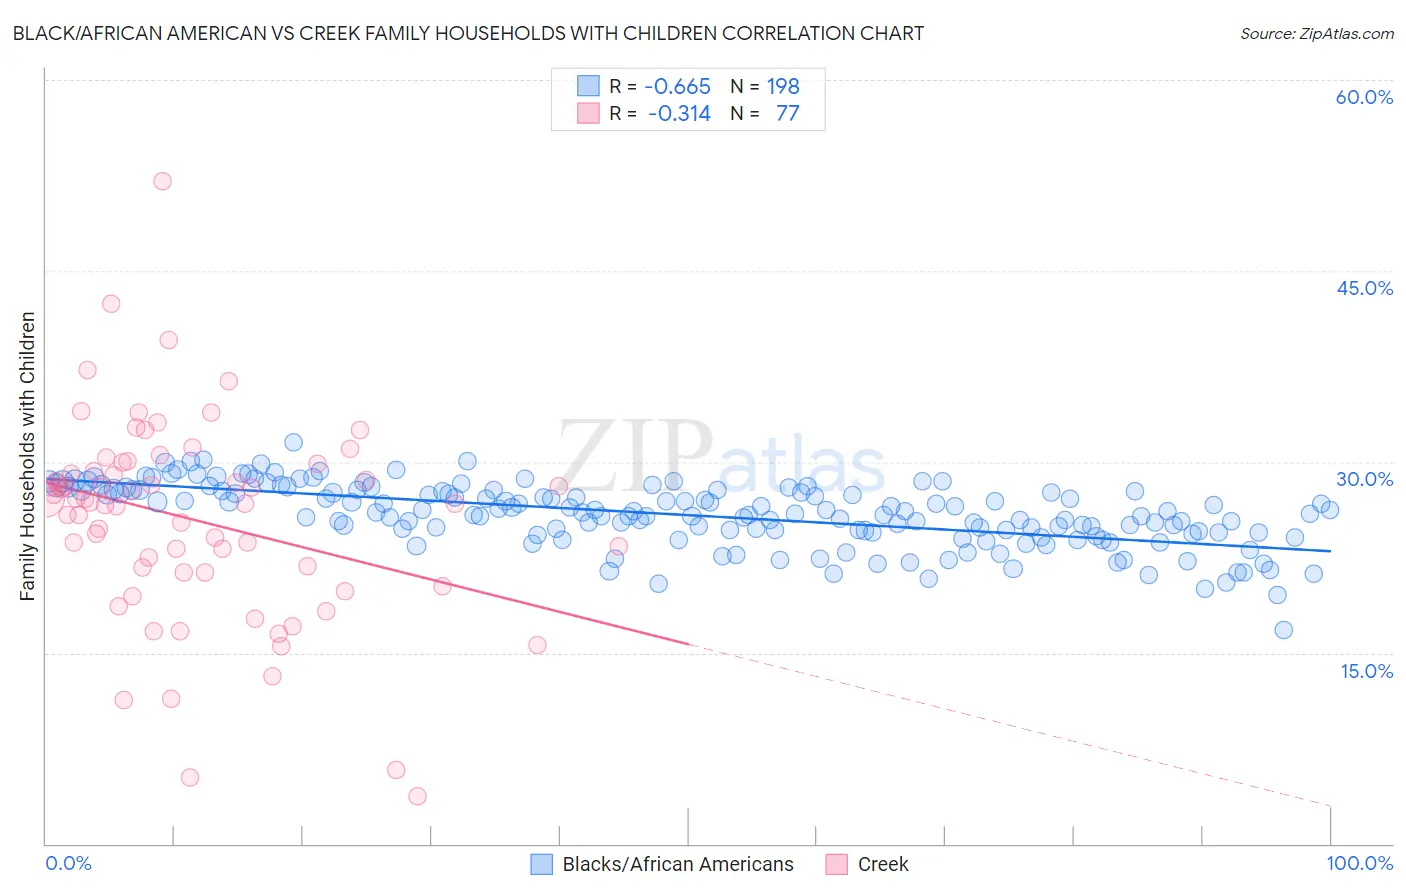
Black/African American vs Creek Family Households with Children Correlation Chart
The statistical analysis conducted on geographies consisting of 564,937,994 people shows a significant negative correlation between the proportion of Blacks/African Americans and percentage of family households with children in the United States with a correlation coefficient (R) of -0.665 and weighted average of 26.5%. Similarly, the statistical analysis conducted on geographies consisting of 178,422,790 people shows a mild negative correlation between the proportion of Creek and percentage of family households with children in the United States with a correlation coefficient (R) of -0.314 and weighted average of 27.4%, a difference of 3.5%.
Family Households with Children Correlation Summary
| Measurement | Black/African American | Creek |
| Minimum | 16.8% | 3.8% |
| Maximum | 31.5% | 52.1% |
| Range | 14.7% | 48.3% |
| Mean | 25.8% | 25.4% |
| Median | 26.0% | 26.8% |
| Interquartile 25% (IQ1) | 24.5% | 21.3% |
| Interquartile 75% (IQ3) | 27.7% | 29.6% |
| Interquartile Range (IQR) | 3.2% | 8.2% |
| Standard Deviation (Sample) | 2.5% | 8.0% |
| Standard Deviation (Population) | 2.4% | 7.9% |
Similar Demographics by Family Households with Children
Demographics Similar to Blacks/African Americans by Family Households with Children
In terms of family households with children, the demographic groups most similar to Blacks/African Americans are Polish (26.5%, a difference of 0.050%), Albanian (26.5%, a difference of 0.060%), Bahamian (26.5%, a difference of 0.060%), Latvian (26.4%, a difference of 0.060%), and Macedonian (26.4%, a difference of 0.13%).
| Demographics | Rating | Rank | Family Households with Children |
| Immigrants | Senegal | 0.2 /100 | #286 | Tragic 26.5% |
| Shoshone | 0.2 /100 | #287 | Tragic 26.5% |
| Russians | 0.2 /100 | #288 | Tragic 26.5% |
| Immigrants | Sweden | 0.2 /100 | #289 | Tragic 26.5% |
| Albanians | 0.2 /100 | #290 | Tragic 26.5% |
| Bahamians | 0.2 /100 | #291 | Tragic 26.5% |
| Poles | 0.2 /100 | #292 | Tragic 26.5% |
| Blacks/African Americans | 0.1 /100 | #293 | Tragic 26.5% |
| Latvians | 0.1 /100 | #294 | Tragic 26.4% |
| Macedonians | 0.1 /100 | #295 | Tragic 26.4% |
| Croatians | 0.1 /100 | #296 | Tragic 26.4% |
| Armenians | 0.1 /100 | #297 | Tragic 26.4% |
| Immigrants | Western Europe | 0.1 /100 | #298 | Tragic 26.4% |
| Trinidadians and Tobagonians | 0.1 /100 | #299 | Tragic 26.4% |
| Paiute | 0.1 /100 | #300 | Tragic 26.4% |
Demographics Similar to Creek by Family Households with Children
In terms of family households with children, the demographic groups most similar to Creek are Immigrants from Brazil (27.4%, a difference of 0.020%), Dutch (27.4%, a difference of 0.020%), Immigrants from Israel (27.4%, a difference of 0.040%), Delaware (27.4%, a difference of 0.050%), and Immigrants from Uruguay (27.4%, a difference of 0.050%).
| Demographics | Rating | Rank | Family Households with Children |
| Immigrants | Turkey | 46.9 /100 | #180 | Average 27.4% |
| Aleuts | 46.7 /100 | #181 | Average 27.4% |
| Puget Sound Salish | 46.2 /100 | #182 | Average 27.4% |
| South Africans | 44.9 /100 | #183 | Average 27.4% |
| Native Hawaiians | 44.6 /100 | #184 | Average 27.4% |
| Delaware | 42.0 /100 | #185 | Average 27.4% |
| Immigrants | Brazil | 40.6 /100 | #186 | Average 27.4% |
| Creek | 39.8 /100 | #187 | Fair 27.4% |
| Dutch | 38.8 /100 | #188 | Fair 27.4% |
| Immigrants | Israel | 37.9 /100 | #189 | Fair 27.4% |
| Immigrants | Uruguay | 37.7 /100 | #190 | Fair 27.4% |
| Sudanese | 37.6 /100 | #191 | Fair 27.4% |
| Pennsylvania Germans | 37.5 /100 | #192 | Fair 27.4% |
| Swedes | 36.9 /100 | #193 | Fair 27.4% |
| Immigrants | Iran | 36.1 /100 | #194 | Fair 27.4% |