Black/African American vs Immigrants from Hong Kong Family Households with Children
COMPARE
Black/African American
Immigrants from Hong Kong
Family Households with Children
Family Households with Children Comparison
Blacks/African Americans
Immigrants from Hong Kong
26.5%
FAMILY HOUSEHOLDS WITH CHILDREN
0.1/ 100
METRIC RATING
293rd/ 347
METRIC RANK
27.5%
FAMILY HOUSEHOLDS WITH CHILDREN
64.9/ 100
METRIC RATING
164th/ 347
METRIC RANK
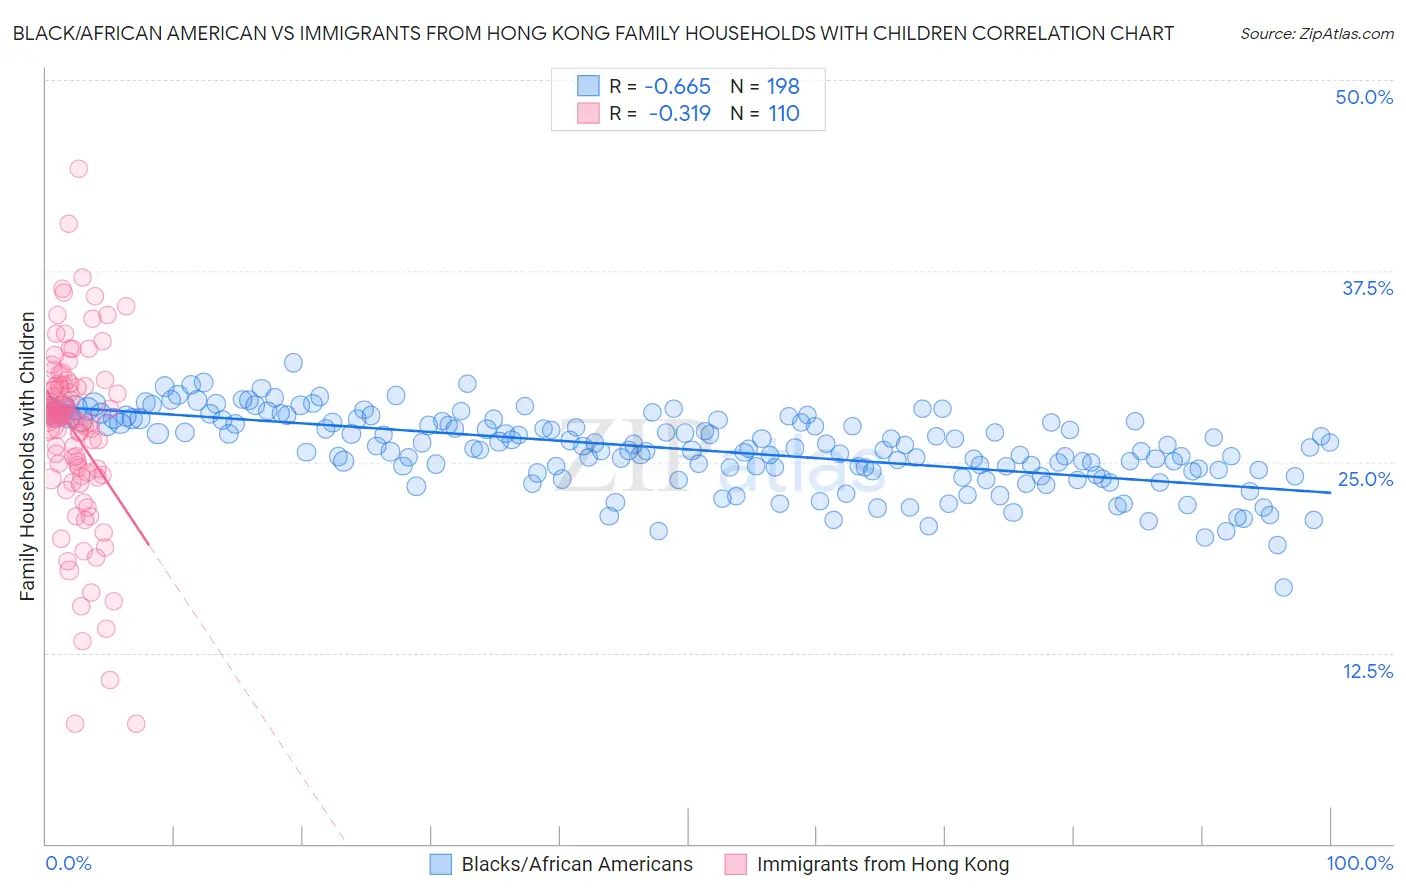
Black/African American vs Immigrants from Hong Kong Family Households with Children Correlation Chart
The statistical analysis conducted on geographies consisting of 564,937,994 people shows a significant negative correlation between the proportion of Blacks/African Americans and percentage of family households with children in the United States with a correlation coefficient (R) of -0.665 and weighted average of 26.5%. Similarly, the statistical analysis conducted on geographies consisting of 253,815,844 people shows a mild negative correlation between the proportion of Immigrants from Hong Kong and percentage of family households with children in the United States with a correlation coefficient (R) of -0.319 and weighted average of 27.5%, a difference of 4.1%.
Family Households with Children Correlation Summary
| Measurement | Black/African American | Immigrants from Hong Kong |
| Minimum | 16.8% | 7.8% |
| Maximum | 31.5% | 44.2% |
| Range | 14.7% | 36.3% |
| Mean | 25.8% | 26.9% |
| Median | 26.0% | 28.0% |
| Interquartile 25% (IQ1) | 24.5% | 24.3% |
| Interquartile 75% (IQ3) | 27.7% | 30.0% |
| Interquartile Range (IQR) | 3.2% | 5.6% |
| Standard Deviation (Sample) | 2.5% | 6.0% |
| Standard Deviation (Population) | 2.4% | 6.0% |
Similar Demographics by Family Households with Children
Demographics Similar to Blacks/African Americans by Family Households with Children
In terms of family households with children, the demographic groups most similar to Blacks/African Americans are Polish (26.5%, a difference of 0.050%), Albanian (26.5%, a difference of 0.060%), Bahamian (26.5%, a difference of 0.060%), Latvian (26.4%, a difference of 0.060%), and Macedonian (26.4%, a difference of 0.13%).
| Demographics | Rating | Rank | Family Households with Children |
| Immigrants | Senegal | 0.2 /100 | #286 | Tragic 26.5% |
| Shoshone | 0.2 /100 | #287 | Tragic 26.5% |
| Russians | 0.2 /100 | #288 | Tragic 26.5% |
| Immigrants | Sweden | 0.2 /100 | #289 | Tragic 26.5% |
| Albanians | 0.2 /100 | #290 | Tragic 26.5% |
| Bahamians | 0.2 /100 | #291 | Tragic 26.5% |
| Poles | 0.2 /100 | #292 | Tragic 26.5% |
| Blacks/African Americans | 0.1 /100 | #293 | Tragic 26.5% |
| Latvians | 0.1 /100 | #294 | Tragic 26.4% |
| Macedonians | 0.1 /100 | #295 | Tragic 26.4% |
| Croatians | 0.1 /100 | #296 | Tragic 26.4% |
| Armenians | 0.1 /100 | #297 | Tragic 26.4% |
| Immigrants | Western Europe | 0.1 /100 | #298 | Tragic 26.4% |
| Trinidadians and Tobagonians | 0.1 /100 | #299 | Tragic 26.4% |
| Paiute | 0.1 /100 | #300 | Tragic 26.4% |
Demographics Similar to Immigrants from Hong Kong by Family Households with Children
In terms of family households with children, the demographic groups most similar to Immigrants from Hong Kong are Czech (27.5%, a difference of 0.010%), Alaskan Athabascan (27.6%, a difference of 0.050%), Immigrants from Bangladesh (27.6%, a difference of 0.050%), Subsaharan African (27.6%, a difference of 0.060%), and Immigrants from South Africa (27.5%, a difference of 0.080%).
| Demographics | Rating | Rank | Family Households with Children |
| Indians (Asian) | 71.6 /100 | #157 | Good 27.6% |
| Romanians | 70.8 /100 | #158 | Good 27.6% |
| Mongolians | 70.7 /100 | #159 | Good 27.6% |
| Sub-Saharan Africans | 67.5 /100 | #160 | Good 27.6% |
| Alaskan Athabascans | 67.1 /100 | #161 | Good 27.6% |
| Immigrants | Bangladesh | 67.0 /100 | #162 | Good 27.6% |
| Czechs | 65.3 /100 | #163 | Good 27.5% |
| Immigrants | Hong Kong | 64.9 /100 | #164 | Good 27.5% |
| Immigrants | South Africa | 61.3 /100 | #165 | Good 27.5% |
| Immigrants | Nonimmigrants | 61.2 /100 | #166 | Good 27.5% |
| Dominicans | 61.1 /100 | #167 | Good 27.5% |
| Immigrants | Kuwait | 60.9 /100 | #168 | Good 27.5% |
| Seminole | 56.9 /100 | #169 | Average 27.5% |
| Cherokee | 56.7 /100 | #170 | Average 27.5% |
| Blackfeet | 54.3 /100 | #171 | Average 27.5% |