Black/African American vs Scandinavian Family Households with Children
COMPARE
Black/African American
Scandinavian
Family Households with Children
Family Households with Children Comparison
Blacks/African Americans
Scandinavians
26.5%
FAMILY HOUSEHOLDS WITH CHILDREN
0.1/ 100
METRIC RATING
293rd/ 347
METRIC RANK
28.0%
FAMILY HOUSEHOLDS WITH CHILDREN
97.1/ 100
METRIC RATING
111th/ 347
METRIC RANK
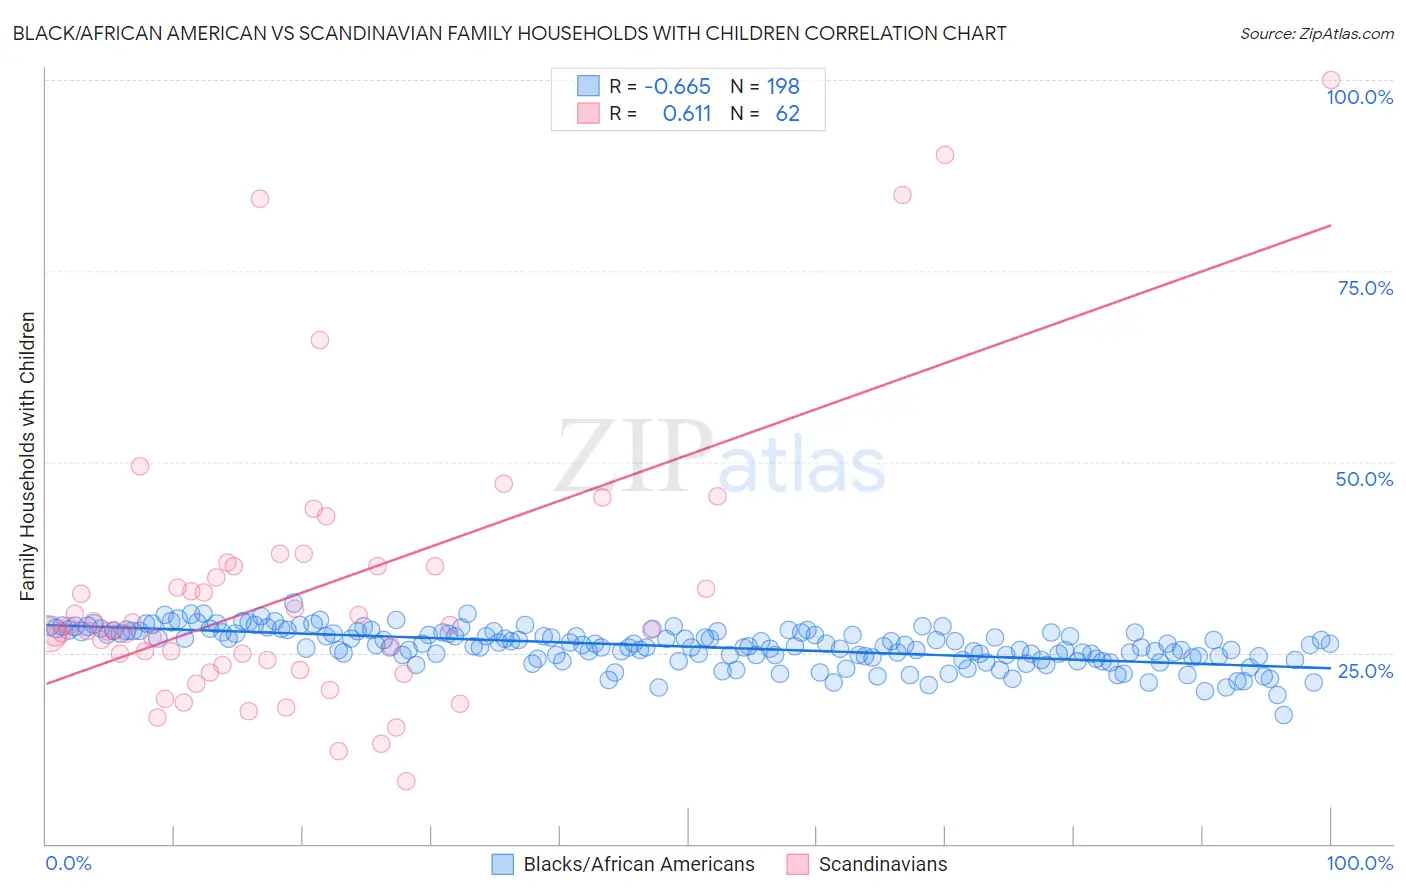
Black/African American vs Scandinavian Family Households with Children Correlation Chart
The statistical analysis conducted on geographies consisting of 564,937,994 people shows a significant negative correlation between the proportion of Blacks/African Americans and percentage of family households with children in the United States with a correlation coefficient (R) of -0.665 and weighted average of 26.5%. Similarly, the statistical analysis conducted on geographies consisting of 472,042,007 people shows a significant positive correlation between the proportion of Scandinavians and percentage of family households with children in the United States with a correlation coefficient (R) of 0.611 and weighted average of 28.0%, a difference of 5.7%.
Family Households with Children Correlation Summary
| Measurement | Black/African American | Scandinavian |
| Minimum | 16.8% | 8.1% |
| Maximum | 31.5% | 100.0% |
| Range | 14.7% | 91.9% |
| Mean | 25.8% | 32.9% |
| Median | 26.0% | 28.0% |
| Interquartile 25% (IQ1) | 24.5% | 23.4% |
| Interquartile 75% (IQ3) | 27.7% | 36.4% |
| Interquartile Range (IQR) | 3.2% | 13.0% |
| Standard Deviation (Sample) | 2.5% | 18.1% |
| Standard Deviation (Population) | 2.4% | 17.9% |
Similar Demographics by Family Households with Children
Demographics Similar to Blacks/African Americans by Family Households with Children
In terms of family households with children, the demographic groups most similar to Blacks/African Americans are Polish (26.5%, a difference of 0.050%), Albanian (26.5%, a difference of 0.060%), Bahamian (26.5%, a difference of 0.060%), Latvian (26.4%, a difference of 0.060%), and Macedonian (26.4%, a difference of 0.13%).
| Demographics | Rating | Rank | Family Households with Children |
| Immigrants | Senegal | 0.2 /100 | #286 | Tragic 26.5% |
| Shoshone | 0.2 /100 | #287 | Tragic 26.5% |
| Russians | 0.2 /100 | #288 | Tragic 26.5% |
| Immigrants | Sweden | 0.2 /100 | #289 | Tragic 26.5% |
| Albanians | 0.2 /100 | #290 | Tragic 26.5% |
| Bahamians | 0.2 /100 | #291 | Tragic 26.5% |
| Poles | 0.2 /100 | #292 | Tragic 26.5% |
| Blacks/African Americans | 0.1 /100 | #293 | Tragic 26.5% |
| Latvians | 0.1 /100 | #294 | Tragic 26.4% |
| Macedonians | 0.1 /100 | #295 | Tragic 26.4% |
| Croatians | 0.1 /100 | #296 | Tragic 26.4% |
| Armenians | 0.1 /100 | #297 | Tragic 26.4% |
| Immigrants | Western Europe | 0.1 /100 | #298 | Tragic 26.4% |
| Trinidadians and Tobagonians | 0.1 /100 | #299 | Tragic 26.4% |
| Paiute | 0.1 /100 | #300 | Tragic 26.4% |
Demographics Similar to Scandinavians by Family Households with Children
In terms of family households with children, the demographic groups most similar to Scandinavians are Immigrants from Middle Africa (28.0%, a difference of 0.030%), Arab (28.0%, a difference of 0.030%), South American Indian (28.0%, a difference of 0.050%), Spaniard (28.0%, a difference of 0.060%), and Immigrants from Africa (28.0%, a difference of 0.060%).
| Demographics | Rating | Rank | Family Households with Children |
| Sioux | 98.3 /100 | #104 | Exceptional 28.1% |
| Choctaw | 98.3 /100 | #105 | Exceptional 28.1% |
| Immigrants | South America | 98.0 /100 | #106 | Exceptional 28.0% |
| Immigrants | Uganda | 97.7 /100 | #107 | Exceptional 28.0% |
| Immigrants | Burma/Myanmar | 97.7 /100 | #108 | Exceptional 28.0% |
| Tohono O'odham | 97.6 /100 | #109 | Exceptional 28.0% |
| Spaniards | 97.4 /100 | #110 | Exceptional 28.0% |
| Scandinavians | 97.1 /100 | #111 | Exceptional 28.0% |
| Immigrants | Middle Africa | 97.0 /100 | #112 | Exceptional 28.0% |
| Arabs | 97.0 /100 | #113 | Exceptional 28.0% |
| South American Indians | 96.9 /100 | #114 | Exceptional 28.0% |
| Immigrants | Africa | 96.8 /100 | #115 | Exceptional 28.0% |
| Pakistanis | 96.0 /100 | #116 | Exceptional 27.9% |
| Immigrants | Malaysia | 95.9 /100 | #117 | Exceptional 27.9% |
| Central American Indians | 95.9 /100 | #118 | Exceptional 27.9% |