Houma vs Iranian Family Households with Children
COMPARE
Houma
Iranian
Family Households with Children
Family Households with Children Comparison
Houma
Iranians
28.5%
FAMILY HOUSEHOLDS WITH CHILDREN
99.9/ 100
METRIC RATING
68th/ 347
METRIC RANK
27.7%
FAMILY HOUSEHOLDS WITH CHILDREN
85.2/ 100
METRIC RATING
133rd/ 347
METRIC RANK
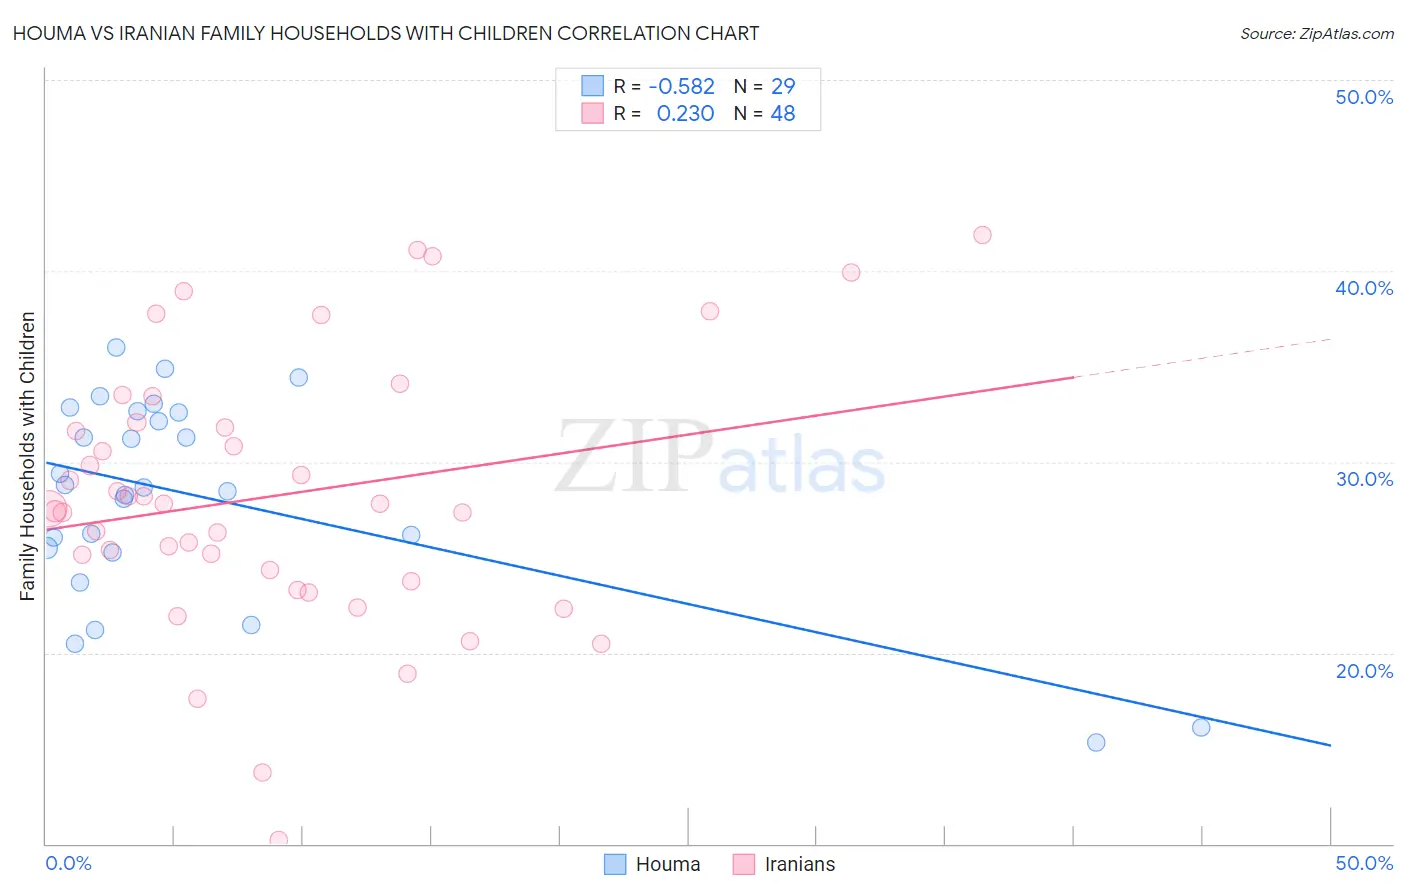
Houma vs Iranian Family Households with Children Correlation Chart
The statistical analysis conducted on geographies consisting of 36,792,477 people shows a substantial negative correlation between the proportion of Houma and percentage of family households with children in the United States with a correlation coefficient (R) of -0.582 and weighted average of 28.5%. Similarly, the statistical analysis conducted on geographies consisting of 316,530,986 people shows a weak positive correlation between the proportion of Iranians and percentage of family households with children in the United States with a correlation coefficient (R) of 0.230 and weighted average of 27.7%, a difference of 2.9%.
Family Households with Children Correlation Summary
| Measurement | Houma | Iranian |
| Minimum | 15.3% | 10.2% |
| Maximum | 36.0% | 41.9% |
| Range | 20.7% | 31.7% |
| Mean | 28.1% | 28.2% |
| Median | 28.7% | 27.7% |
| Interquartile 25% (IQ1) | 25.4% | 24.0% |
| Interquartile 75% (IQ3) | 32.6% | 31.9% |
| Interquartile Range (IQR) | 7.3% | 7.9% |
| Standard Deviation (Sample) | 5.4% | 7.0% |
| Standard Deviation (Population) | 5.3% | 6.9% |
Similar Demographics by Family Households with Children
Demographics Similar to Houma by Family Households with Children
In terms of family households with children, the demographic groups most similar to Houma are Honduran (28.5%, a difference of 0.020%), Immigrants from Egypt (28.5%, a difference of 0.020%), Ghanaian (28.5%, a difference of 0.020%), Immigrants from Korea (28.5%, a difference of 0.020%), and Immigrants from Honduras (28.5%, a difference of 0.070%).
| Demographics | Rating | Rank | Family Households with Children |
| Immigrants | Ghana | 99.9 /100 | #61 | Exceptional 28.6% |
| Egyptians | 99.9 /100 | #62 | Exceptional 28.6% |
| Immigrants | Lebanon | 99.9 /100 | #63 | Exceptional 28.6% |
| Filipinos | 99.9 /100 | #64 | Exceptional 28.6% |
| Hondurans | 99.9 /100 | #65 | Exceptional 28.5% |
| Immigrants | Egypt | 99.9 /100 | #66 | Exceptional 28.5% |
| Ghanaians | 99.9 /100 | #67 | Exceptional 28.5% |
| Houma | 99.9 /100 | #68 | Exceptional 28.5% |
| Immigrants | Korea | 99.9 /100 | #69 | Exceptional 28.5% |
| Immigrants | Honduras | 99.9 /100 | #70 | Exceptional 28.5% |
| Burmese | 99.9 /100 | #71 | Exceptional 28.5% |
| Immigrants | Indonesia | 99.9 /100 | #72 | Exceptional 28.5% |
| Iraqis | 99.9 /100 | #73 | Exceptional 28.5% |
| Laotians | 99.9 /100 | #74 | Exceptional 28.5% |
| Immigrants | Jordan | 99.9 /100 | #75 | Exceptional 28.4% |
Demographics Similar to Iranians by Family Households with Children
In terms of family households with children, the demographic groups most similar to Iranians are Immigrants from Panama (27.7%, a difference of 0.010%), Immigrants from Belize (27.7%, a difference of 0.020%), Immigrants from Ecuador (27.7%, a difference of 0.030%), Immigrants from Portugal (27.7%, a difference of 0.040%), and Immigrants from Dominican Republic (27.7%, a difference of 0.060%).
| Demographics | Rating | Rank | Family Households with Children |
| Immigrants | Ethiopia | 90.5 /100 | #126 | Exceptional 27.8% |
| Belizeans | 90.0 /100 | #127 | Exceptional 27.8% |
| Syrians | 89.7 /100 | #128 | Excellent 27.8% |
| Immigrants | Eritrea | 89.4 /100 | #129 | Excellent 27.8% |
| Cajuns | 87.6 /100 | #130 | Excellent 27.7% |
| Lebanese | 87.4 /100 | #131 | Excellent 27.7% |
| Immigrants | Belize | 85.7 /100 | #132 | Excellent 27.7% |
| Iranians | 85.2 /100 | #133 | Excellent 27.7% |
| Immigrants | Panama | 84.9 /100 | #134 | Excellent 27.7% |
| Immigrants | Ecuador | 84.6 /100 | #135 | Excellent 27.7% |
| Immigrants | Portugal | 84.1 /100 | #136 | Excellent 27.7% |
| Immigrants | Dominican Republic | 83.9 /100 | #137 | Excellent 27.7% |
| Uruguayans | 83.2 /100 | #138 | Excellent 27.7% |
| Vietnamese | 82.6 /100 | #139 | Excellent 27.7% |
| Spanish | 81.8 /100 | #140 | Excellent 27.7% |