Black/African American vs Slavic Family Households with Children
COMPARE
Black/African American
Slavic
Family Households with Children
Family Households with Children Comparison
Blacks/African Americans
Slavs
26.5%
FAMILY HOUSEHOLDS WITH CHILDREN
0.1/ 100
METRIC RATING
293rd/ 347
METRIC RANK
26.8%
FAMILY HOUSEHOLDS WITH CHILDREN
1.3/ 100
METRIC RATING
257th/ 347
METRIC RANK
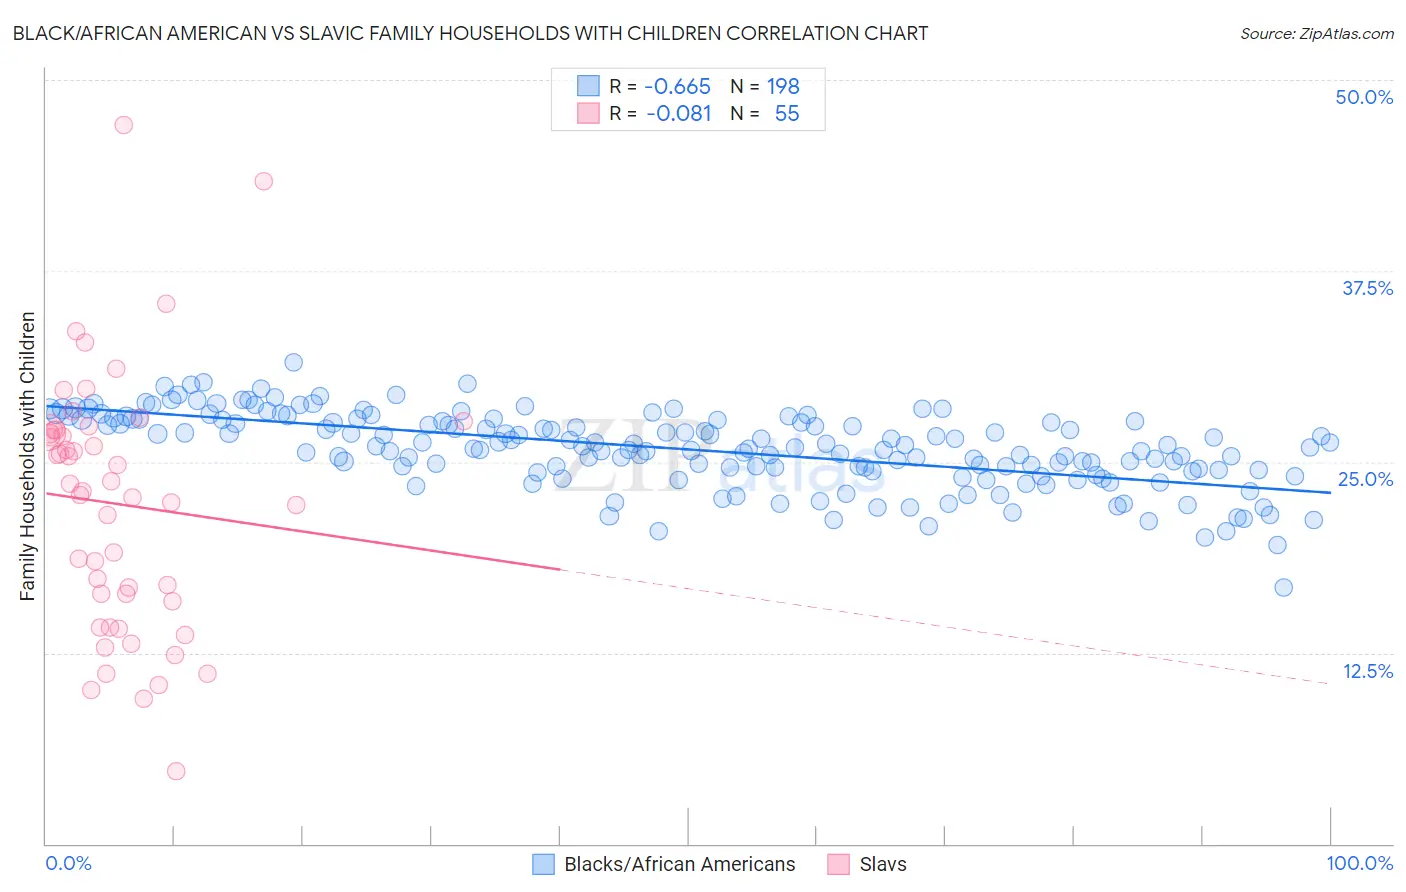
Black/African American vs Slavic Family Households with Children Correlation Chart
The statistical analysis conducted on geographies consisting of 564,937,994 people shows a significant negative correlation between the proportion of Blacks/African Americans and percentage of family households with children in the United States with a correlation coefficient (R) of -0.665 and weighted average of 26.5%. Similarly, the statistical analysis conducted on geographies consisting of 270,744,912 people shows a slight negative correlation between the proportion of Slavs and percentage of family households with children in the United States with a correlation coefficient (R) of -0.081 and weighted average of 26.8%, a difference of 1.3%.
Family Households with Children Correlation Summary
| Measurement | Black/African American | Slavic |
| Minimum | 16.8% | 4.7% |
| Maximum | 31.5% | 47.1% |
| Range | 14.7% | 42.3% |
| Mean | 25.8% | 22.2% |
| Median | 26.0% | 23.1% |
| Interquartile 25% (IQ1) | 24.5% | 15.9% |
| Interquartile 75% (IQ3) | 27.7% | 27.1% |
| Interquartile Range (IQR) | 3.2% | 11.2% |
| Standard Deviation (Sample) | 2.5% | 8.4% |
| Standard Deviation (Population) | 2.4% | 8.3% |
Similar Demographics by Family Households with Children
Demographics Similar to Blacks/African Americans by Family Households with Children
In terms of family households with children, the demographic groups most similar to Blacks/African Americans are Polish (26.5%, a difference of 0.050%), Albanian (26.5%, a difference of 0.060%), Bahamian (26.5%, a difference of 0.060%), Latvian (26.4%, a difference of 0.060%), and Macedonian (26.4%, a difference of 0.13%).
| Demographics | Rating | Rank | Family Households with Children |
| Immigrants | Senegal | 0.2 /100 | #286 | Tragic 26.5% |
| Shoshone | 0.2 /100 | #287 | Tragic 26.5% |
| Russians | 0.2 /100 | #288 | Tragic 26.5% |
| Immigrants | Sweden | 0.2 /100 | #289 | Tragic 26.5% |
| Albanians | 0.2 /100 | #290 | Tragic 26.5% |
| Bahamians | 0.2 /100 | #291 | Tragic 26.5% |
| Poles | 0.2 /100 | #292 | Tragic 26.5% |
| Blacks/African Americans | 0.1 /100 | #293 | Tragic 26.5% |
| Latvians | 0.1 /100 | #294 | Tragic 26.4% |
| Macedonians | 0.1 /100 | #295 | Tragic 26.4% |
| Croatians | 0.1 /100 | #296 | Tragic 26.4% |
| Armenians | 0.1 /100 | #297 | Tragic 26.4% |
| Immigrants | Western Europe | 0.1 /100 | #298 | Tragic 26.4% |
| Trinidadians and Tobagonians | 0.1 /100 | #299 | Tragic 26.4% |
| Paiute | 0.1 /100 | #300 | Tragic 26.4% |
Demographics Similar to Slavs by Family Households with Children
In terms of family households with children, the demographic groups most similar to Slavs are Immigrants from Cuba (26.8%, a difference of 0.010%), Immigrants from Lithuania (26.8%, a difference of 0.040%), Scotch-Irish (26.8%, a difference of 0.050%), Immigrants from Jamaica (26.8%, a difference of 0.050%), and German Russian (26.8%, a difference of 0.060%).
| Demographics | Rating | Rank | Family Households with Children |
| Belgians | 2.1 /100 | #250 | Tragic 26.9% |
| Immigrants | Bosnia and Herzegovina | 1.9 /100 | #251 | Tragic 26.8% |
| Irish | 1.8 /100 | #252 | Tragic 26.8% |
| Italians | 1.5 /100 | #253 | Tragic 26.8% |
| Immigrants | Scotland | 1.5 /100 | #254 | Tragic 26.8% |
| German Russians | 1.5 /100 | #255 | Tragic 26.8% |
| Scotch-Irish | 1.4 /100 | #256 | Tragic 26.8% |
| Slavs | 1.3 /100 | #257 | Tragic 26.8% |
| Immigrants | Cuba | 1.3 /100 | #258 | Tragic 26.8% |
| Immigrants | Lithuania | 1.2 /100 | #259 | Tragic 26.8% |
| Immigrants | Jamaica | 1.2 /100 | #260 | Tragic 26.8% |
| Immigrants | Belarus | 1.1 /100 | #261 | Tragic 26.8% |
| Immigrants | Russia | 1.0 /100 | #262 | Tragic 26.8% |
| Immigrants | North Macedonia | 1.0 /100 | #263 | Tragic 26.7% |
| Taiwanese | 0.9 /100 | #264 | Tragic 26.7% |