Black/African American vs Immigrants from Chile Family Households with Children
COMPARE
Black/African American
Immigrants from Chile
Family Households with Children
Family Households with Children Comparison
Blacks/African Americans
Immigrants from Chile
26.5%
FAMILY HOUSEHOLDS WITH CHILDREN
0.1/ 100
METRIC RATING
293rd/ 347
METRIC RANK
27.7%
FAMILY HOUSEHOLDS WITH CHILDREN
79.5/ 100
METRIC RATING
145th/ 347
METRIC RANK
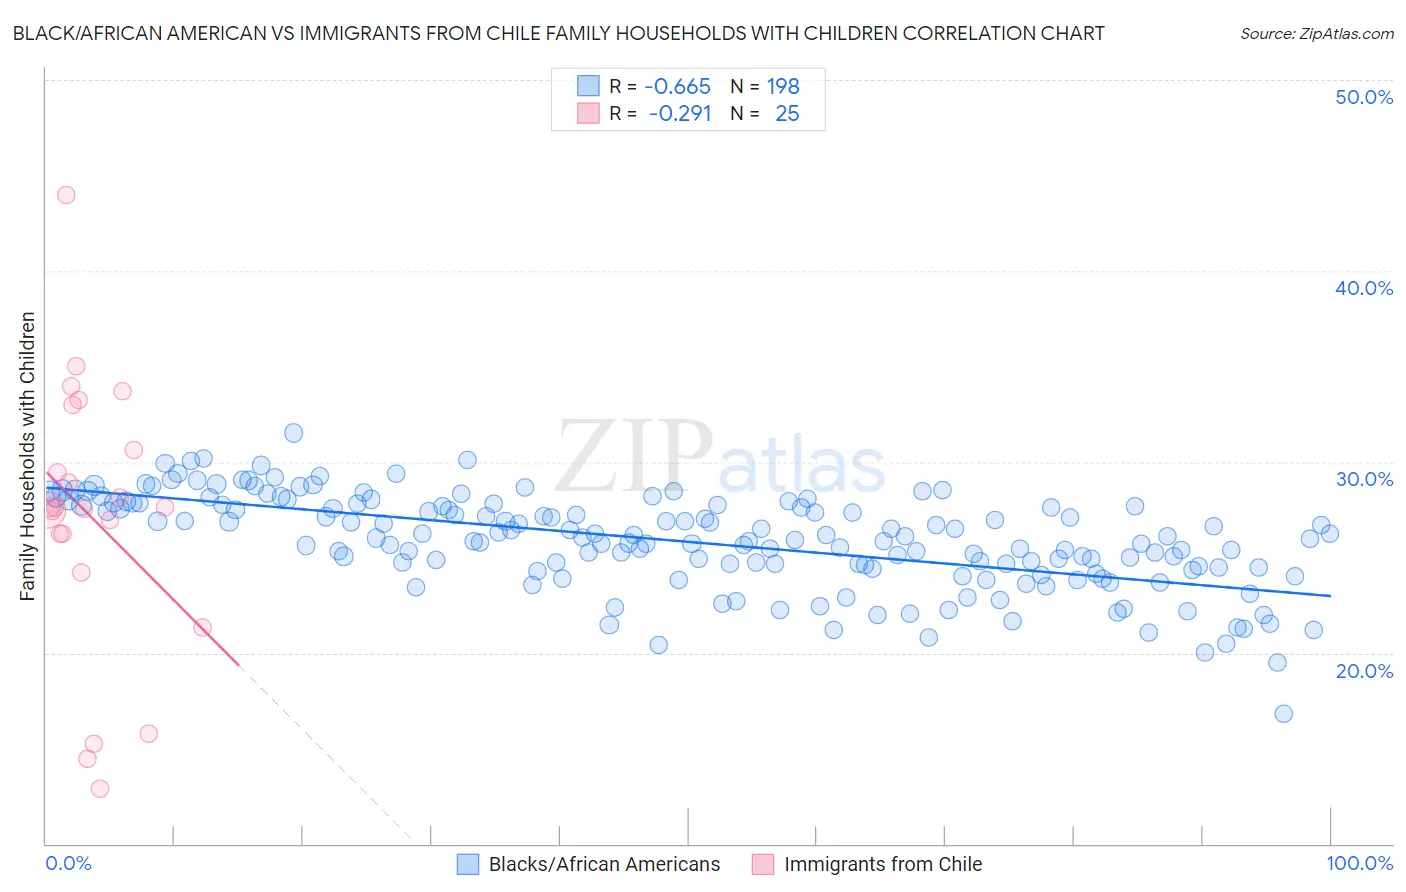
Black/African American vs Immigrants from Chile Family Households with Children Correlation Chart
The statistical analysis conducted on geographies consisting of 564,937,994 people shows a significant negative correlation between the proportion of Blacks/African Americans and percentage of family households with children in the United States with a correlation coefficient (R) of -0.665 and weighted average of 26.5%. Similarly, the statistical analysis conducted on geographies consisting of 218,581,482 people shows a weak negative correlation between the proportion of Immigrants from Chile and percentage of family households with children in the United States with a correlation coefficient (R) of -0.291 and weighted average of 27.7%, a difference of 4.5%.
Family Households with Children Correlation Summary
| Measurement | Black/African American | Immigrants from Chile |
| Minimum | 16.8% | 12.9% |
| Maximum | 31.5% | 44.0% |
| Range | 14.7% | 31.1% |
| Mean | 25.8% | 27.1% |
| Median | 26.0% | 27.6% |
| Interquartile 25% (IQ1) | 24.5% | 25.2% |
| Interquartile 75% (IQ3) | 27.7% | 31.8% |
| Interquartile Range (IQR) | 3.2% | 6.6% |
| Standard Deviation (Sample) | 2.5% | 7.1% |
| Standard Deviation (Population) | 2.4% | 7.0% |
Similar Demographics by Family Households with Children
Demographics Similar to Blacks/African Americans by Family Households with Children
In terms of family households with children, the demographic groups most similar to Blacks/African Americans are Polish (26.5%, a difference of 0.050%), Albanian (26.5%, a difference of 0.060%), Bahamian (26.5%, a difference of 0.060%), Latvian (26.4%, a difference of 0.060%), and Macedonian (26.4%, a difference of 0.13%).
| Demographics | Rating | Rank | Family Households with Children |
| Immigrants | Senegal | 0.2 /100 | #286 | Tragic 26.5% |
| Shoshone | 0.2 /100 | #287 | Tragic 26.5% |
| Russians | 0.2 /100 | #288 | Tragic 26.5% |
| Immigrants | Sweden | 0.2 /100 | #289 | Tragic 26.5% |
| Albanians | 0.2 /100 | #290 | Tragic 26.5% |
| Bahamians | 0.2 /100 | #291 | Tragic 26.5% |
| Poles | 0.2 /100 | #292 | Tragic 26.5% |
| Blacks/African Americans | 0.1 /100 | #293 | Tragic 26.5% |
| Latvians | 0.1 /100 | #294 | Tragic 26.4% |
| Macedonians | 0.1 /100 | #295 | Tragic 26.4% |
| Croatians | 0.1 /100 | #296 | Tragic 26.4% |
| Armenians | 0.1 /100 | #297 | Tragic 26.4% |
| Immigrants | Western Europe | 0.1 /100 | #298 | Tragic 26.4% |
| Trinidadians and Tobagonians | 0.1 /100 | #299 | Tragic 26.4% |
| Paiute | 0.1 /100 | #300 | Tragic 26.4% |
Demographics Similar to Immigrants from Chile by Family Households with Children
In terms of family households with children, the demographic groups most similar to Immigrants from Chile are Basque (27.7%, a difference of 0.0%), Brazilian (27.7%, a difference of 0.010%), Immigrants from Moldova (27.6%, a difference of 0.010%), Osage (27.6%, a difference of 0.020%), and Menominee (27.6%, a difference of 0.020%).
| Demographics | Rating | Rank | Family Households with Children |
| Uruguayans | 83.2 /100 | #138 | Excellent 27.7% |
| Vietnamese | 82.6 /100 | #139 | Excellent 27.7% |
| Spanish | 81.8 /100 | #140 | Excellent 27.7% |
| Immigrants | Eastern Asia | 81.7 /100 | #141 | Excellent 27.7% |
| Swiss | 81.4 /100 | #142 | Excellent 27.7% |
| Immigrants | Eastern Africa | 80.2 /100 | #143 | Excellent 27.7% |
| Brazilians | 79.6 /100 | #144 | Good 27.7% |
| Immigrants | Chile | 79.5 /100 | #145 | Good 27.7% |
| Basques | 79.5 /100 | #146 | Good 27.7% |
| Immigrants | Moldova | 79.1 /100 | #147 | Good 27.6% |
| Osage | 79.0 /100 | #148 | Good 27.6% |
| Menominee | 78.9 /100 | #149 | Good 27.6% |
| Argentineans | 78.5 /100 | #150 | Good 27.6% |
| Portuguese | 77.8 /100 | #151 | Good 27.6% |
| Ethiopians | 77.0 /100 | #152 | Good 27.6% |