Black/African American vs Puerto Rican Family Households with Children
COMPARE
Black/African American
Puerto Rican
Family Households with Children
Family Households with Children Comparison
Blacks/African Americans
Puerto Ricans
26.5%
FAMILY HOUSEHOLDS WITH CHILDREN
0.1/ 100
METRIC RATING
293rd/ 347
METRIC RANK
25.6%
FAMILY HOUSEHOLDS WITH CHILDREN
0.0/ 100
METRIC RATING
337th/ 347
METRIC RANK
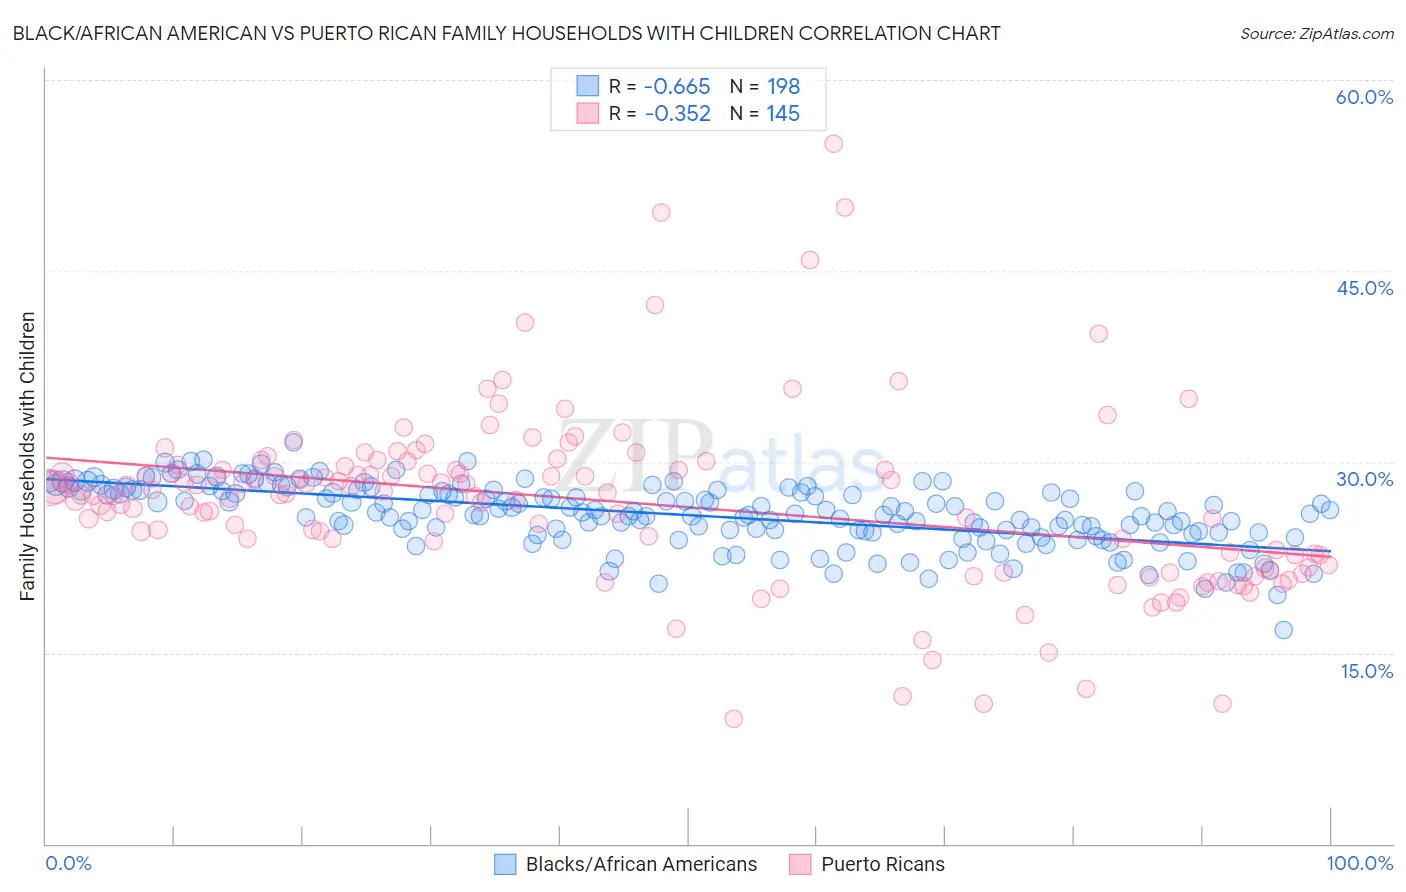
Black/African American vs Puerto Rican Family Households with Children Correlation Chart
The statistical analysis conducted on geographies consisting of 564,937,994 people shows a significant negative correlation between the proportion of Blacks/African Americans and percentage of family households with children in the United States with a correlation coefficient (R) of -0.665 and weighted average of 26.5%. Similarly, the statistical analysis conducted on geographies consisting of 527,477,936 people shows a mild negative correlation between the proportion of Puerto Ricans and percentage of family households with children in the United States with a correlation coefficient (R) of -0.352 and weighted average of 25.6%, a difference of 3.5%.
Family Households with Children Correlation Summary
| Measurement | Black/African American | Puerto Rican |
| Minimum | 16.8% | 9.8% |
| Maximum | 31.5% | 54.9% |
| Range | 14.7% | 45.1% |
| Mean | 25.8% | 26.9% |
| Median | 26.0% | 27.4% |
| Interquartile 25% (IQ1) | 24.5% | 22.3% |
| Interquartile 75% (IQ3) | 27.7% | 29.5% |
| Interquartile Range (IQR) | 3.2% | 7.3% |
| Standard Deviation (Sample) | 2.5% | 6.9% |
| Standard Deviation (Population) | 2.4% | 6.9% |
Similar Demographics by Family Households with Children
Demographics Similar to Blacks/African Americans by Family Households with Children
In terms of family households with children, the demographic groups most similar to Blacks/African Americans are Polish (26.5%, a difference of 0.050%), Albanian (26.5%, a difference of 0.060%), Bahamian (26.5%, a difference of 0.060%), Latvian (26.4%, a difference of 0.060%), and Macedonian (26.4%, a difference of 0.13%).
| Demographics | Rating | Rank | Family Households with Children |
| Immigrants | Senegal | 0.2 /100 | #286 | Tragic 26.5% |
| Shoshone | 0.2 /100 | #287 | Tragic 26.5% |
| Russians | 0.2 /100 | #288 | Tragic 26.5% |
| Immigrants | Sweden | 0.2 /100 | #289 | Tragic 26.5% |
| Albanians | 0.2 /100 | #290 | Tragic 26.5% |
| Bahamians | 0.2 /100 | #291 | Tragic 26.5% |
| Poles | 0.2 /100 | #292 | Tragic 26.5% |
| Blacks/African Americans | 0.1 /100 | #293 | Tragic 26.5% |
| Latvians | 0.1 /100 | #294 | Tragic 26.4% |
| Macedonians | 0.1 /100 | #295 | Tragic 26.4% |
| Croatians | 0.1 /100 | #296 | Tragic 26.4% |
| Armenians | 0.1 /100 | #297 | Tragic 26.4% |
| Immigrants | Western Europe | 0.1 /100 | #298 | Tragic 26.4% |
| Trinidadians and Tobagonians | 0.1 /100 | #299 | Tragic 26.4% |
| Paiute | 0.1 /100 | #300 | Tragic 26.4% |
Demographics Similar to Puerto Ricans by Family Households with Children
In terms of family households with children, the demographic groups most similar to Puerto Ricans are Arapaho (25.6%, a difference of 0.030%), Immigrants from St. Vincent and the Grenadines (25.6%, a difference of 0.040%), Immigrants from Armenia (25.6%, a difference of 0.080%), Immigrants from West Indies (25.7%, a difference of 0.39%), and Immigrants from Serbia (25.5%, a difference of 0.46%).
| Demographics | Rating | Rank | Family Households with Children |
| Immigrants | Latvia | 0.0 /100 | #330 | Tragic 25.9% |
| Slovenes | 0.0 /100 | #331 | Tragic 25.8% |
| Immigrants | Austria | 0.0 /100 | #332 | Tragic 25.8% |
| Immigrants | Switzerland | 0.0 /100 | #333 | Tragic 25.7% |
| Slovaks | 0.0 /100 | #334 | Tragic 25.7% |
| Immigrants | Croatia | 0.0 /100 | #335 | Tragic 25.7% |
| Immigrants | West Indies | 0.0 /100 | #336 | Tragic 25.7% |
| Puerto Ricans | 0.0 /100 | #337 | Tragic 25.6% |
| Arapaho | 0.0 /100 | #338 | Tragic 25.6% |
| Immigrants | St. Vincent and the Grenadines | 0.0 /100 | #339 | Tragic 25.6% |
| Immigrants | Armenia | 0.0 /100 | #340 | Tragic 25.6% |
| Immigrants | Serbia | 0.0 /100 | #341 | Tragic 25.5% |
| Alsatians | 0.0 /100 | #342 | Tragic 25.3% |
| Hopi | 0.0 /100 | #343 | Tragic 25.2% |
| Pueblo | 0.0 /100 | #344 | Tragic 25.2% |