Blackfeet vs Immigrants from Zaire Currently Married
COMPARE
Blackfeet
Immigrants from Zaire
Currently Married
Currently Married Comparison
Blackfeet
Immigrants from Zaire
44.2%
CURRENTLY MARRIED
0.3/ 100
METRIC RATING
251st/ 347
METRIC RANK
42.0%
CURRENTLY MARRIED
0.0/ 100
METRIC RATING
302nd/ 347
METRIC RANK
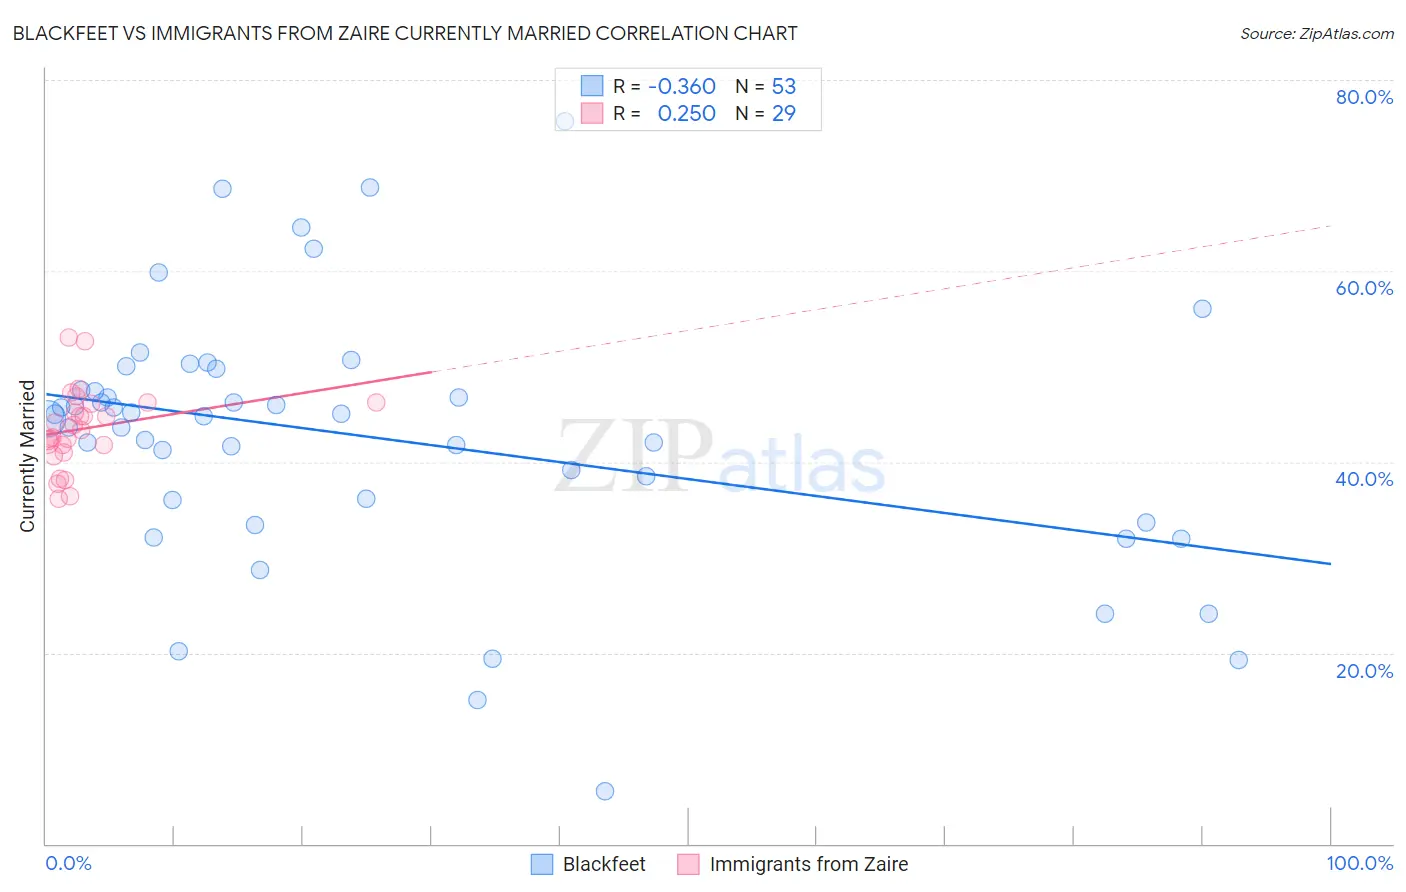
Blackfeet vs Immigrants from Zaire Currently Married Correlation Chart
The statistical analysis conducted on geographies consisting of 309,564,713 people shows a mild negative correlation between the proportion of Blackfeet and percentage of population currently married in the United States with a correlation coefficient (R) of -0.360 and weighted average of 44.2%. Similarly, the statistical analysis conducted on geographies consisting of 107,251,110 people shows a weak positive correlation between the proportion of Immigrants from Zaire and percentage of population currently married in the United States with a correlation coefficient (R) of 0.250 and weighted average of 42.0%, a difference of 5.3%.
Currently Married Correlation Summary
| Measurement | Blackfeet | Immigrants from Zaire |
| Minimum | 5.5% | 36.1% |
| Maximum | 75.7% | 53.1% |
| Range | 70.2% | 16.9% |
| Mean | 42.5% | 43.5% |
| Median | 44.8% | 43.4% |
| Interquartile 25% (IQ1) | 34.9% | 41.4% |
| Interquartile 75% (IQ3) | 48.6% | 46.1% |
| Interquartile Range (IQR) | 13.7% | 4.8% |
| Standard Deviation (Sample) | 13.6% | 4.1% |
| Standard Deviation (Population) | 13.4% | 4.0% |
Similar Demographics by Currently Married
Demographics Similar to Blackfeet by Currently Married
In terms of currently married, the demographic groups most similar to Blackfeet are Hispanic or Latino (44.1%, a difference of 0.020%), Immigrants from Central America (44.1%, a difference of 0.050%), Immigrants from Eastern Africa (44.2%, a difference of 0.060%), Immigrants from Cameroon (44.2%, a difference of 0.080%), and Nicaraguan (44.2%, a difference of 0.10%).
| Demographics | Rating | Rank | Currently Married |
| Japanese | 0.6 /100 | #244 | Tragic 44.5% |
| Immigrants | Armenia | 0.4 /100 | #245 | Tragic 44.3% |
| Immigrants | Burma/Myanmar | 0.4 /100 | #246 | Tragic 44.3% |
| Ugandans | 0.4 /100 | #247 | Tragic 44.2% |
| Nicaraguans | 0.3 /100 | #248 | Tragic 44.2% |
| Immigrants | Cameroon | 0.3 /100 | #249 | Tragic 44.2% |
| Immigrants | Eastern Africa | 0.3 /100 | #250 | Tragic 44.2% |
| Blackfeet | 0.3 /100 | #251 | Tragic 44.2% |
| Hispanics or Latinos | 0.3 /100 | #252 | Tragic 44.1% |
| Immigrants | Central America | 0.3 /100 | #253 | Tragic 44.1% |
| Vietnamese | 0.2 /100 | #254 | Tragic 44.0% |
| Yakama | 0.2 /100 | #255 | Tragic 44.0% |
| Shoshone | 0.2 /100 | #256 | Tragic 44.0% |
| Immigrants | Africa | 0.2 /100 | #257 | Tragic 43.9% |
| Ute | 0.2 /100 | #258 | Tragic 43.9% |
Demographics Similar to Immigrants from Zaire by Currently Married
In terms of currently married, the demographic groups most similar to Immigrants from Zaire are Sioux (41.9%, a difference of 0.010%), Immigrants from Bahamas (41.9%, a difference of 0.13%), Immigrants from Trinidad and Tobago (41.9%, a difference of 0.16%), Immigrants from Guyana (41.9%, a difference of 0.17%), and Immigrants from Yemen (42.1%, a difference of 0.25%).
| Demographics | Rating | Rank | Currently Married |
| Immigrants | Western Africa | 0.0 /100 | #295 | Tragic 42.4% |
| Menominee | 0.0 /100 | #296 | Tragic 42.3% |
| Cheyenne | 0.0 /100 | #297 | Tragic 42.2% |
| Immigrants | Honduras | 0.0 /100 | #298 | Tragic 42.2% |
| Liberians | 0.0 /100 | #299 | Tragic 42.2% |
| Belizeans | 0.0 /100 | #300 | Tragic 42.2% |
| Immigrants | Yemen | 0.0 /100 | #301 | Tragic 42.1% |
| Immigrants | Zaire | 0.0 /100 | #302 | Tragic 42.0% |
| Sioux | 0.0 /100 | #303 | Tragic 41.9% |
| Immigrants | Bahamas | 0.0 /100 | #304 | Tragic 41.9% |
| Immigrants | Trinidad and Tobago | 0.0 /100 | #305 | Tragic 41.9% |
| Immigrants | Guyana | 0.0 /100 | #306 | Tragic 41.9% |
| Africans | 0.0 /100 | #307 | Tragic 41.8% |
| Immigrants | Belize | 0.0 /100 | #308 | Tragic 41.8% |
| Immigrants | Liberia | 0.0 /100 | #309 | Tragic 41.8% |