Blackfeet vs Japanese Currently Married
COMPARE
Blackfeet
Japanese
Currently Married
Currently Married Comparison
Blackfeet
Japanese
44.2%
CURRENTLY MARRIED
0.3/ 100
METRIC RATING
251st/ 347
METRIC RANK
44.5%
CURRENTLY MARRIED
0.6/ 100
METRIC RATING
244th/ 347
METRIC RANK
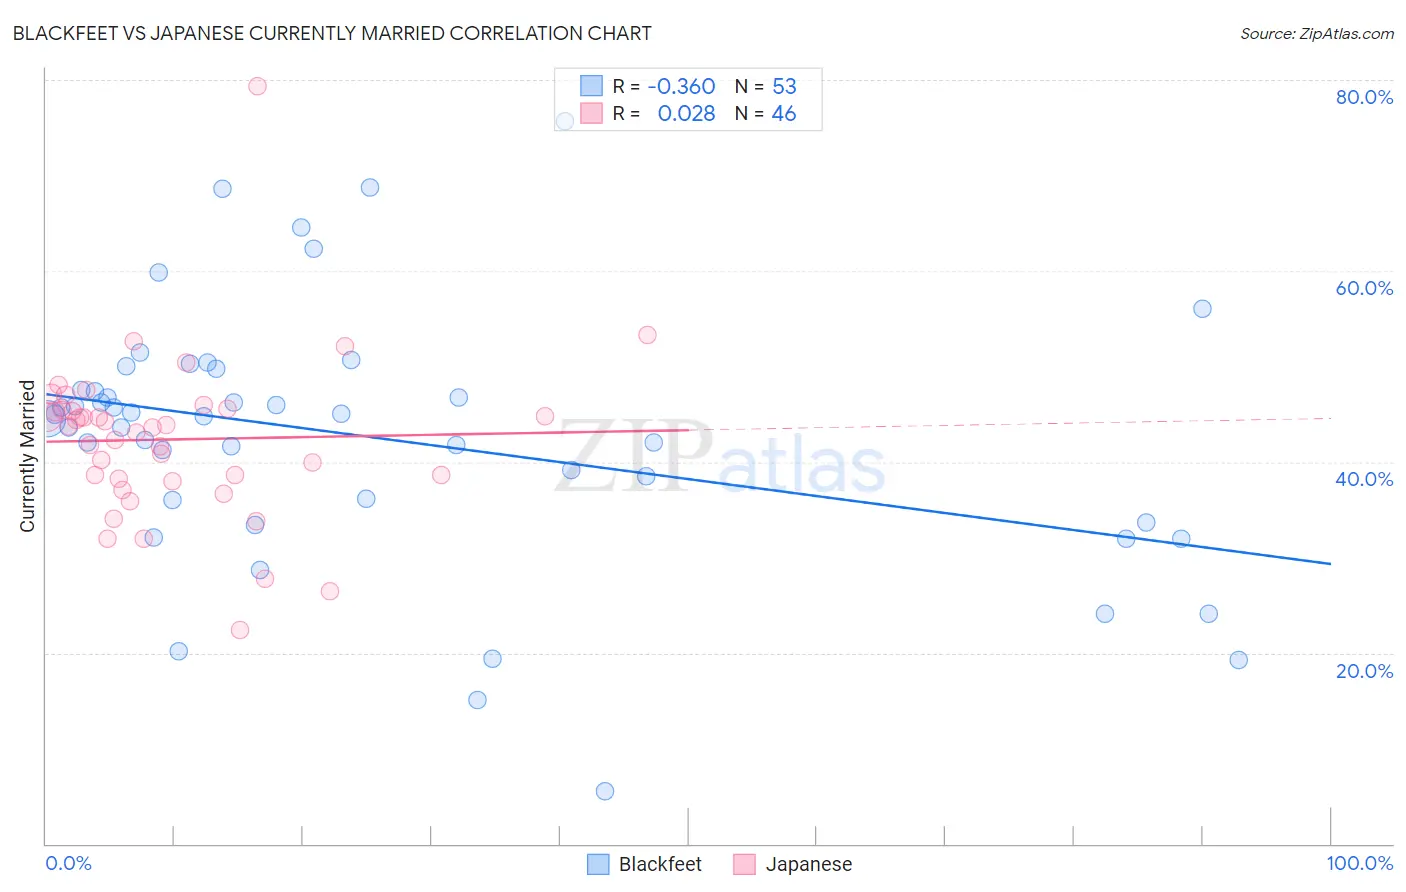
Blackfeet vs Japanese Currently Married Correlation Chart
The statistical analysis conducted on geographies consisting of 309,564,713 people shows a mild negative correlation between the proportion of Blackfeet and percentage of population currently married in the United States with a correlation coefficient (R) of -0.360 and weighted average of 44.2%. Similarly, the statistical analysis conducted on geographies consisting of 249,168,550 people shows no correlation between the proportion of Japanese and percentage of population currently married in the United States with a correlation coefficient (R) of 0.028 and weighted average of 44.5%, a difference of 0.70%.
Currently Married Correlation Summary
| Measurement | Blackfeet | Japanese |
| Minimum | 5.5% | 22.4% |
| Maximum | 75.7% | 79.3% |
| Range | 70.2% | 56.9% |
| Mean | 42.5% | 42.3% |
| Median | 44.8% | 43.7% |
| Interquartile 25% (IQ1) | 34.9% | 38.2% |
| Interquartile 75% (IQ3) | 48.6% | 45.4% |
| Interquartile Range (IQR) | 13.7% | 7.2% |
| Standard Deviation (Sample) | 13.6% | 8.6% |
| Standard Deviation (Population) | 13.4% | 8.6% |
Demographics Similar to Blackfeet and Japanese by Currently Married
In terms of currently married, the demographic groups most similar to Blackfeet are Hispanic or Latino (44.1%, a difference of 0.020%), Immigrants from Central America (44.1%, a difference of 0.050%), Immigrants from Eastern Africa (44.2%, a difference of 0.060%), Immigrants from Cameroon (44.2%, a difference of 0.080%), and Nicaraguan (44.2%, a difference of 0.10%). Similarly, the demographic groups most similar to Japanese are Immigrants from Ethiopia (44.5%, a difference of 0.070%), Immigrants from Cambodia (44.5%, a difference of 0.090%), Ethiopian (44.5%, a difference of 0.12%), Immigrants from Mexico (44.5%, a difference of 0.18%), and Mexican American Indian (44.5%, a difference of 0.18%).
| Demographics | Rating | Rank | Currently Married |
| Seminole | 0.9 /100 | #237 | Tragic 44.6% |
| Moroccans | 0.9 /100 | #238 | Tragic 44.6% |
| Immigrants | Mexico | 0.7 /100 | #239 | Tragic 44.5% |
| Mexican American Indians | 0.7 /100 | #240 | Tragic 44.5% |
| Ethiopians | 0.7 /100 | #241 | Tragic 44.5% |
| Immigrants | Cambodia | 0.7 /100 | #242 | Tragic 44.5% |
| Immigrants | Ethiopia | 0.7 /100 | #243 | Tragic 44.5% |
| Japanese | 0.6 /100 | #244 | Tragic 44.5% |
| Immigrants | Armenia | 0.4 /100 | #245 | Tragic 44.3% |
| Immigrants | Burma/Myanmar | 0.4 /100 | #246 | Tragic 44.3% |
| Ugandans | 0.4 /100 | #247 | Tragic 44.2% |
| Nicaraguans | 0.3 /100 | #248 | Tragic 44.2% |
| Immigrants | Cameroon | 0.3 /100 | #249 | Tragic 44.2% |
| Immigrants | Eastern Africa | 0.3 /100 | #250 | Tragic 44.2% |
| Blackfeet | 0.3 /100 | #251 | Tragic 44.2% |
| Hispanics or Latinos | 0.3 /100 | #252 | Tragic 44.1% |
| Immigrants | Central America | 0.3 /100 | #253 | Tragic 44.1% |
| Vietnamese | 0.2 /100 | #254 | Tragic 44.0% |
| Yakama | 0.2 /100 | #255 | Tragic 44.0% |
| Shoshone | 0.2 /100 | #256 | Tragic 44.0% |
| Immigrants | Africa | 0.2 /100 | #257 | Tragic 43.9% |