Blackfeet vs Immigrants from Zaire Professional Degree

COMPARE

Blackfeet
Race
Ancestry
AfghanAfricanAlaska NativeAlaskan AthabascanAlbanianAleutAlsatianAmericanApacheArabArapahoArgentineanArmenianAssyrian/Chaldean/SyriacAustralianAustrianBahamianBangladeshiBarbadianBasqueBelgianBelizeanBermudanBhutaneseBlackfeetBolivianBrazilianBritishBritish West IndianBulgarianBurmeseCajunCambodianCanadianCape VerdeanCarpatho RusynCelticCentral AmericanCentral American IndianCherokeeCheyenneChickasawChileanChineseChippewaChoctawColombianColvilleComancheCosta RicanCreeCreekCroatianCrowCubanCypriotCzechCzechoslovakianDanishDelawareDominicanDutchDutch West IndianEastern EuropeanEcuadorianEgyptianEnglishEstonianEthiopianEuropeanFijianFilipinoFinnishFrenchFrench American IndianFrench CanadianGermanGerman RussianGhanaianGreekGuamanian/ChamorroGuatemalanGuyaneseHaitianHmongHonduranHopiHoumaHungarianIcelanderIndian (Asian)IndonesianInupiatIranianIraqiIrishIroquoisIsraeliItalianJamaicanJapaneseJordanianKenyanKiowaKoreanLaotianLatvianLebaneseLiberianLithuanianLumbeeLuxembourgerMacedonianMalaysianMalteseMarshalleseMenomineeMexicanMexican American IndianMongolianMoroccanNative HawaiianNavajoNepaleseNew ZealanderNicaraguanNigerianNorthern EuropeanNorwegianOkinawanOsageOttawaPaiutePakistaniPalestinianPanamanianParaguayanPennsylvania GermanPeruvianPimaPolishPortuguesePotawatomiPuebloPuerto RicanPuget Sound SalishRomanianRussianSalvadoranSamoanScandinavianScotch-IrishScottishSeminoleSenegaleseSerbianShoshoneSierra LeoneanSiouxSlavicSlovakSloveneSomaliSouth AfricanSouth AmericanSouth American IndianSoviet UnionSpaniardSpanishSpanish AmericanSpanish American IndianSri LankanSubsaharan AfricanSudaneseSwedishSwissSyrianTaiwaneseThaiTlingit-HaidaTohono O'OdhamTonganTrinidadian and TobagonianTsimshianTurkishU.S. Virgin IslanderUgandanUkrainianUruguayanUteVenezuelanVietnameseWelshWest IndianYakamaYaquiYugoslavianYumanYup'ikZimbabwean
Immigration
NonimmigrantsImmigrantsAfghanistanAfricaAlbaniaArgentinaArmeniaAsiaAustraliaAustriaBahamasBangladeshBarbadosBelarusBelgiumBelizeBoliviaBosnia and HerzegovinaBrazilBulgariaBurma/MyanmarCabo VerdeCambodiaCameroonCanadaCaribbeanCentral AmericaChileChinaColombiaCongoCosta RicaCroatiaCubaCzechoslovakiaDenmarkDominicaDominican RepublicEastern AfricaEastern AsiaEastern EuropeEcuadorEgyptEl SalvadorEnglandEritreaEthiopiaEuropeFijiFranceGermanyGhanaGreeceGrenadaGuatemalaGuyanaHaitiHondurasHong KongHungaryIndiaIndonesiaIranIraqIrelandIsraelItalyJamaicaJapanJordanKazakhstanKenyaKoreaKuwaitLaosLatin AmericaLatviaLebanonLiberiaLithuaniaMalaysiaMexicoMicronesiaMiddle AfricaMoldovaMoroccoNepalNetherlandsNicaraguaNigeriaNorth AmericaNorth MacedoniaNorthern AfricaNorthern EuropeNorwayOceaniaPakistanPanamaPeruPhilippinesPolandPortugalRomaniaRussiaSaudi ArabiaScotlandSenegalSerbiaSierra LeoneSingaporeSomaliaSouth AfricaSouth AmericaSouth Central AsiaSouth Eastern AsiaSouthern EuropeSpainSri LankaSt. Vincent and the GrenadinesSudanSwedenSwitzerlandSyriaTaiwanThailandTrinidad and TobagoTurkeyUgandaUkraineUruguayUzbekistanVenezuelaVietnamWest IndiesWestern AfricaWestern AsiaWestern EuropeYemenZimbabweAzores
Immigrants from Zaire
Race
Ancestry
AfghanAfricanAlaska NativeAlaskan AthabascanAlbanianAleutAlsatianAmericanApacheArabArapahoArgentineanArmenianAssyrian/Chaldean/SyriacAustralianAustrianBahamianBangladeshiBarbadianBasqueBelgianBelizeanBermudanBhutaneseBolivianBrazilianBritishBritish West IndianBulgarianBurmeseCajunCambodianCanadianCape VerdeanCarpatho RusynCelticCentral AmericanCentral American IndianCherokeeCheyenneChickasawChileanChineseChippewaChoctawColombianColvilleComancheCosta RicanCreeCreekCroatianCrowCubanCypriotCzechCzechoslovakianDanishDelawareDominicanDutchDutch West IndianEastern EuropeanEcuadorianEgyptianEnglishEstonianEthiopianEuropeanFijianFilipinoFinnishFrenchFrench American IndianFrench CanadianGermanGerman RussianGhanaianGreekGuamanian/ChamorroGuatemalanGuyaneseHaitianHmongHonduranHopiHoumaHungarianIcelanderIndian (Asian)IndonesianInupiatIranianIraqiIrishIroquoisIsraeliItalianJamaicanJapaneseJordanianKenyanKiowaKoreanLaotianLatvianLebaneseLiberianLithuanianLumbeeLuxembourgerMacedonianMalaysianMalteseMarshalleseMenomineeMexicanMexican American IndianMongolianMoroccanNative HawaiianNavajoNepaleseNew ZealanderNicaraguanNigerianNorthern EuropeanNorwegianOkinawanOsageOttawaPaiutePakistaniPalestinianPanamanianParaguayanPennsylvania GermanPeruvianPimaPolishPortuguesePotawatomiPuebloPuerto RicanPuget Sound SalishRomanianRussianSalvadoranSamoanScandinavianScotch-IrishScottishSeminoleSenegaleseSerbianShoshoneSierra LeoneanSiouxSlavicSlovakSloveneSomaliSouth AfricanSouth AmericanSouth American IndianSoviet UnionSpaniardSpanishSpanish AmericanSpanish American IndianSri LankanSubsaharan AfricanSudaneseSwedishSwissSyrianTaiwaneseThaiTlingit-HaidaTohono O'OdhamTonganTrinidadian and TobagonianTsimshianTurkishU.S. Virgin IslanderUgandanUkrainianUruguayanUteVenezuelanVietnameseWelshWest IndianYakamaYaquiYugoslavianYumanYup'ikZimbabwean
Immigration
NonimmigrantsImmigrantsAfghanistanAfricaAlbaniaArgentinaArmeniaAsiaAustraliaAustriaBahamasBangladeshBarbadosBelarusBelgiumBelizeBoliviaBosnia and HerzegovinaBrazilBulgariaBurma/MyanmarCabo VerdeCambodiaCameroonCanadaCaribbeanCentral AmericaChileChinaColombiaCongoCosta RicaCroatiaCubaCzechoslovakiaDenmarkDominicaDominican RepublicEastern AfricaEastern AsiaEastern EuropeEcuadorEgyptEl SalvadorEnglandEritreaEthiopiaEuropeFijiFranceGermanyGhanaGreeceGrenadaGuatemalaGuyanaHaitiHondurasHong KongHungaryIndiaIndonesiaIranIraqIrelandIsraelItalyJamaicaJapanJordanKazakhstanKenyaKoreaKuwaitLaosLatin AmericaLatviaLebanonLiberiaLithuaniaMalaysiaMexicoMicronesiaMiddle AfricaMoldovaMoroccoNepalNetherlandsNicaraguaNigeriaNorth AmericaNorth MacedoniaNorthern AfricaNorthern EuropeNorwayOceaniaPakistanPanamaPeruPhilippinesPolandPortugalRomaniaRussiaSaudi ArabiaScotlandSenegalSerbiaSierra LeoneSingaporeSomaliaSouth AfricaSouth AmericaSouth Central AsiaSouth Eastern AsiaSouthern EuropeSpainSri LankaSt. Vincent and the GrenadinesSudanSwedenSwitzerlandSyriaTaiwanThailandTrinidad and TobagoTurkeyUgandaUkraineUruguayUzbekistanVenezuelaVietnamWest IndiesWestern AfricaWestern AsiaWestern EuropeYemenZaireZimbabweAzores
Professional Degree
Income
Poverty
Unemployment
Labor Participation
Family Structure
Vehicle Availability
Education Level
Disability

Professional Degree Comparison

Blackfeet

Immigrants from Zaire

Tragic
Average
3.5%
PROFESSIONAL DEGREE
0.3/ 100
METRIC RATING
288th/ 347
METRIC RANK
4.5%
PROFESSIONAL DEGREE
57.4/ 100
METRIC RATING
170th/ 347
METRIC RANK

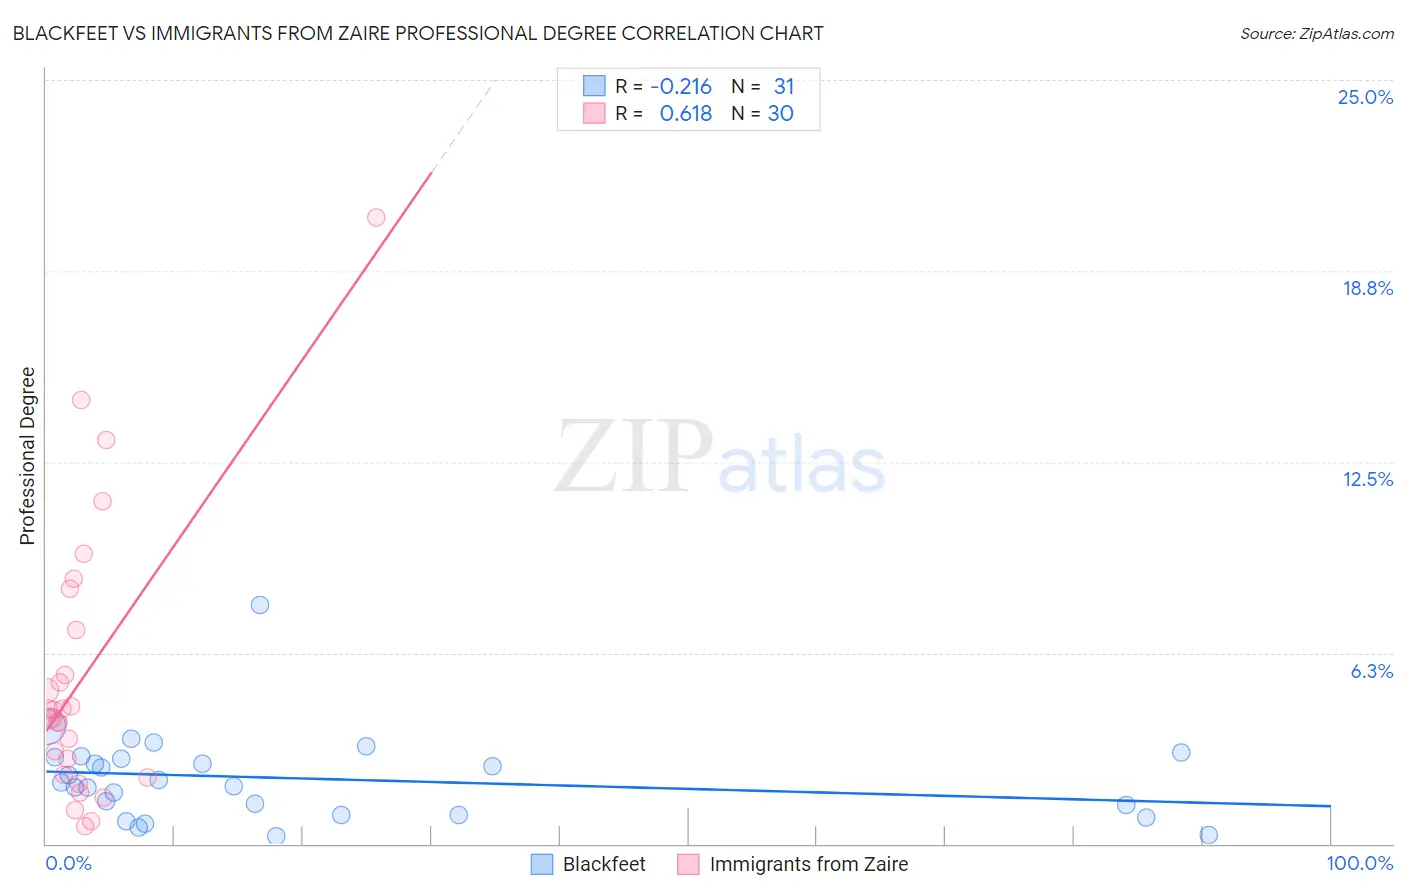
Blackfeet vs Immigrants from Zaire Professional Degree Correlation Chart

The statistical analysis conducted on geographies consisting of 308,370,699 people shows a weak negative correlation between the proportion of Blackfeet and percentage of population with at least professional degree education in the United States with a correlation coefficient (R) of -0.216 and weighted average of 3.5%. Similarly, the statistical analysis conducted on geographies consisting of 107,228,641 people shows a significant positive correlation between the proportion of Immigrants from Zaire and percentage of population with at least professional degree education in the United States with a correlation coefficient (R) of 0.618 and weighted average of 4.5%, a difference of 28.2%.
Blackfeet vs Immigrants from Zaire Professional Degree

Professional Degree Correlation Summary

MeasurementBlackfeetImmigrants from Zaire
Minimum0.26%0.59%
Maximum7.8%20.5%
Range7.5%19.9%
Mean2.1%5.5%
Median2.0%4.2%
Interquartile 25% (IQ1)0.95%2.3%
Interquartile 75% (IQ3)2.8%7.0%
Interquartile Range (IQR)1.9%4.7%
Standard Deviation (Sample)1.4%4.5%
Standard Deviation (Population)1.4%4.5%

Similar Demographics by Professional Degree

Demographics Similar to Blackfeet by Professional Degree

In terms of professional degree, the demographic groups most similar to Blackfeet are Immigrants from El Salvador (3.5%, a difference of 0.050%), Haitian (3.5%, a difference of 0.15%), Guatemalan (3.5%, a difference of 0.17%), Chippewa (3.5%, a difference of 0.19%), and Alaska Native (3.5%, a difference of 0.36%).
DemographicsRating | RankProfessional Degree
Apache
0.5
/100
|
#281
Tragic
3.5%
Immigrants | Caribbean
0.5
/100
|
#282
Tragic
3.5%
Comanche
0.4
/100
|
#283
Tragic
3.5%
Salvadorans
0.4
/100
|
#284
Tragic
3.5%
Hondurans
0.3
/100
|
#285
Tragic
3.5%
Haitians
0.3
/100
|
#286
Tragic
3.5%
Immigrants | El Salvador
0.3
/100
|
#287
Tragic
3.5%
Blackfeet
0.3
/100
|
#288
Tragic
3.5%
Guatemalans
0.3
/100
|
#289
Tragic
3.5%
Chippewa
0.3
/100
|
#290
Tragic
3.5%
Alaska Natives
0.3
/100
|
#291
Tragic
3.5%
Immigrants | Belize
0.3
/100
|
#292
Tragic
3.5%
Immigrants | Honduras
0.3
/100
|
#293
Tragic
3.5%
Paiute
0.3
/100
|
#294
Tragic
3.4%
Immigrants | Guatemala
0.2
/100
|
#295
Tragic
3.4%

Demographics Similar to Immigrants from Zaire by Professional Degree

In terms of professional degree, the demographic groups most similar to Immigrants from Zaire are Chinese (4.5%, a difference of 0.18%), Immigrants from Sierra Leone (4.5%, a difference of 0.19%), Immigrants from Bangladesh (4.4%, a difference of 0.22%), Immigrants from Afghanistan (4.5%, a difference of 0.26%), and Immigrants from Colombia (4.5%, a difference of 0.29%).
DemographicsRating | RankProfessional Degree
Sierra Leoneans
64.3
/100
|
#163
Good
4.5%
Swiss
61.0
/100
|
#164
Good
4.5%
Costa Ricans
59.9
/100
|
#165
Average
4.5%
Immigrants | Colombia
59.4
/100
|
#166
Average
4.5%
Immigrants | Afghanistan
59.2
/100
|
#167
Average
4.5%
Immigrants | Sierra Leone
58.7
/100
|
#168
Average
4.5%
Chinese
58.6
/100
|
#169
Average
4.5%
Immigrants | Zaire
57.4
/100
|
#170
Average
4.5%
Immigrants | Bangladesh
56.0
/100
|
#171
Average
4.4%
Spaniards
52.0
/100
|
#172
Average
4.4%
English
50.1
/100
|
#173
Average
4.4%
Kenyans
50.0
/100
|
#174
Average
4.4%
Irish
50.0
/100
|
#175
Average
4.4%
Immigrants | Peru
49.3
/100
|
#176
Average
4.4%
Celtics
47.6
/100
|
#177
Average
4.4%