Blackfeet vs Immigrants from Zaire Disability Age 5 to 17
COMPARE
Blackfeet
Immigrants from Zaire
Disability Age 5 to 17
Disability Age 5 to 17 Comparison
Blackfeet
Immigrants from Zaire
6.6%
DISABILITY AGE 5 TO 17
0.0/ 100
METRIC RATING
329th/ 347
METRIC RANK
6.0%
DISABILITY AGE 5 TO 17
0.2/ 100
METRIC RATING
271st/ 347
METRIC RANK
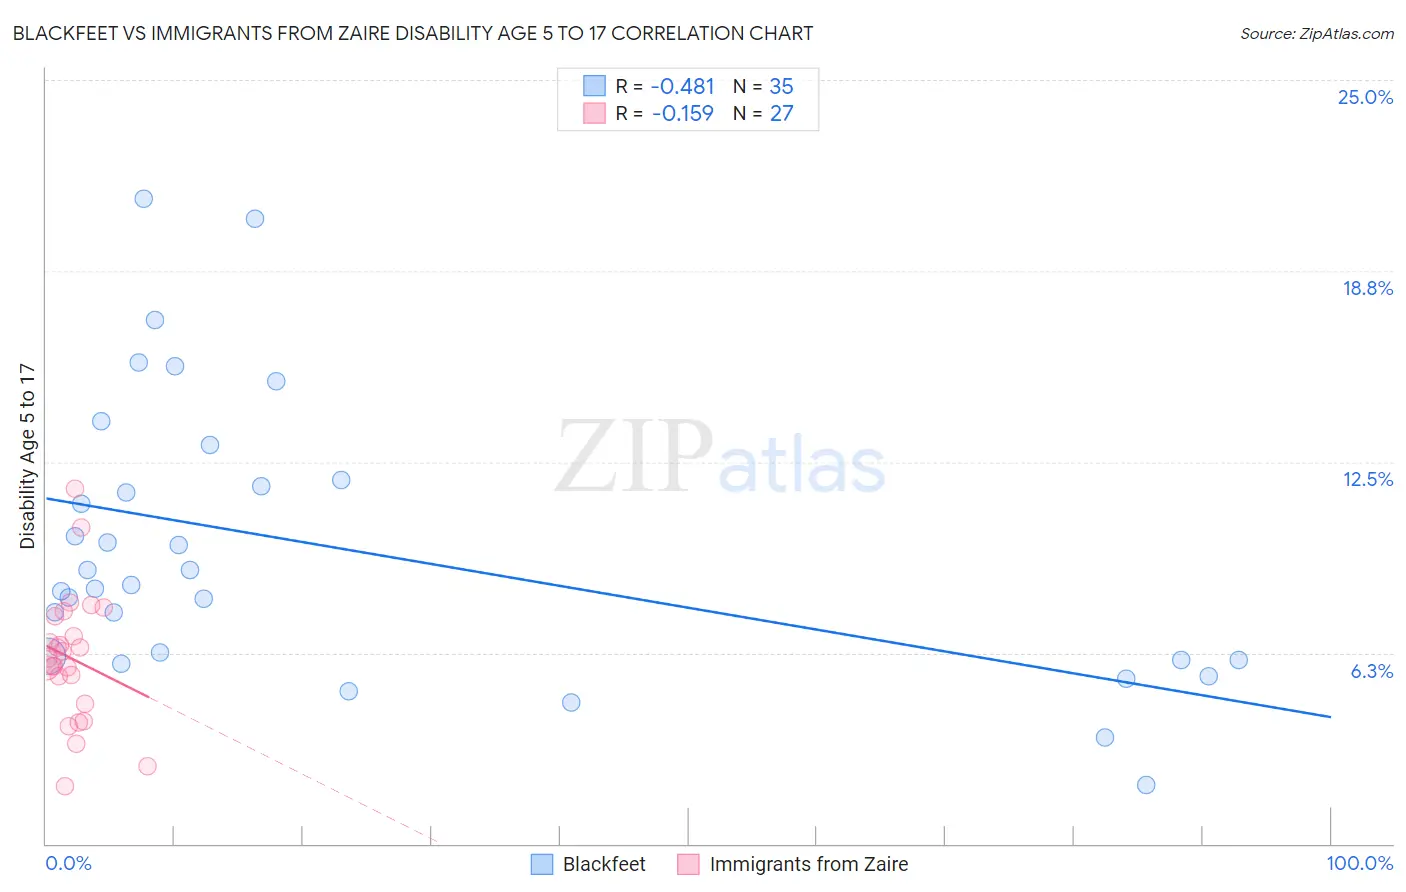
Blackfeet vs Immigrants from Zaire Disability Age 5 to 17 Correlation Chart
The statistical analysis conducted on geographies consisting of 307,715,312 people shows a moderate negative correlation between the proportion of Blackfeet and percentage of population with a disability between the ages 5 and 17 in the United States with a correlation coefficient (R) of -0.481 and weighted average of 6.6%. Similarly, the statistical analysis conducted on geographies consisting of 107,054,393 people shows a poor negative correlation between the proportion of Immigrants from Zaire and percentage of population with a disability between the ages 5 and 17 in the United States with a correlation coefficient (R) of -0.159 and weighted average of 6.0%, a difference of 9.3%.
Disability Age 5 to 17 Correlation Summary
| Measurement | Blackfeet | Immigrants from Zaire |
| Minimum | 1.9% | 1.9% |
| Maximum | 21.1% | 11.6% |
| Range | 19.2% | 9.7% |
| Mean | 9.7% | 6.1% |
| Median | 8.5% | 6.1% |
| Interquartile 25% (IQ1) | 6.0% | 4.6% |
| Interquartile 75% (IQ3) | 11.9% | 7.4% |
| Interquartile Range (IQR) | 5.9% | 2.8% |
| Standard Deviation (Sample) | 4.6% | 2.1% |
| Standard Deviation (Population) | 4.5% | 2.1% |
Similar Demographics by Disability Age 5 to 17
Demographics Similar to Blackfeet by Disability Age 5 to 17
In terms of disability age 5 to 17, the demographic groups most similar to Blackfeet are Pennsylvania German (6.6%, a difference of 0.17%), French American Indian (6.6%, a difference of 0.40%), Potawatomi (6.5%, a difference of 0.84%), American (6.5%, a difference of 0.97%), and Dominican (6.5%, a difference of 1.0%).
| Demographics | Rating | Rank | Disability Age 5 to 17 |
| Slovaks | 0.0 /100 | #322 | Tragic 6.5% |
| Osage | 0.0 /100 | #323 | Tragic 6.5% |
| Dominicans | 0.0 /100 | #324 | Tragic 6.5% |
| Americans | 0.0 /100 | #325 | Tragic 6.5% |
| Potawatomi | 0.0 /100 | #326 | Tragic 6.5% |
| French American Indians | 0.0 /100 | #327 | Tragic 6.6% |
| Pennsylvania Germans | 0.0 /100 | #328 | Tragic 6.6% |
| Blackfeet | 0.0 /100 | #329 | Tragic 6.6% |
| Dutch West Indians | 0.0 /100 | #330 | Tragic 6.7% |
| French Canadians | 0.0 /100 | #331 | Tragic 6.7% |
| Immigrants | Azores | 0.0 /100 | #332 | Tragic 6.7% |
| Blacks/African Americans | 0.0 /100 | #333 | Tragic 6.8% |
| Seminole | 0.0 /100 | #334 | Tragic 6.8% |
| Ottawa | 0.0 /100 | #335 | Tragic 6.8% |
| Chickasaw | 0.0 /100 | #336 | Tragic 6.8% |
Demographics Similar to Immigrants from Zaire by Disability Age 5 to 17
In terms of disability age 5 to 17, the demographic groups most similar to Immigrants from Zaire are Finnish (6.0%, a difference of 0.030%), Alaska Native (6.0%, a difference of 0.080%), Cheyenne (6.0%, a difference of 0.19%), Dutch (6.0%, a difference of 0.30%), and Japanese (6.1%, a difference of 0.40%).
| Demographics | Rating | Rank | Disability Age 5 to 17 |
| Canadians | 0.6 /100 | #264 | Tragic 6.0% |
| Panamanians | 0.6 /100 | #265 | Tragic 6.0% |
| Slovenes | 0.6 /100 | #266 | Tragic 6.0% |
| Spanish | 0.5 /100 | #267 | Tragic 6.0% |
| Sioux | 0.4 /100 | #268 | Tragic 6.0% |
| Liberians | 0.4 /100 | #269 | Tragic 6.0% |
| Immigrants | Somalia | 0.4 /100 | #270 | Tragic 6.0% |
| Immigrants | Zaire | 0.2 /100 | #271 | Tragic 6.0% |
| Finns | 0.2 /100 | #272 | Tragic 6.0% |
| Alaska Natives | 0.2 /100 | #273 | Tragic 6.0% |
| Cheyenne | 0.2 /100 | #274 | Tragic 6.0% |
| Dutch | 0.2 /100 | #275 | Tragic 6.0% |
| Japanese | 0.1 /100 | #276 | Tragic 6.1% |
| Puget Sound Salish | 0.1 /100 | #277 | Tragic 6.1% |
| Immigrants | Liberia | 0.1 /100 | #278 | Tragic 6.1% |