Bolivian vs Immigrants from Zaire Currently Married
COMPARE
Bolivian
Immigrants from Zaire
Currently Married
Currently Married Comparison
Bolivians
Immigrants from Zaire
48.1%
CURRENTLY MARRIED
96.9/ 100
METRIC RATING
83rd/ 347
METRIC RANK
42.0%
CURRENTLY MARRIED
0.0/ 100
METRIC RATING
302nd/ 347
METRIC RANK
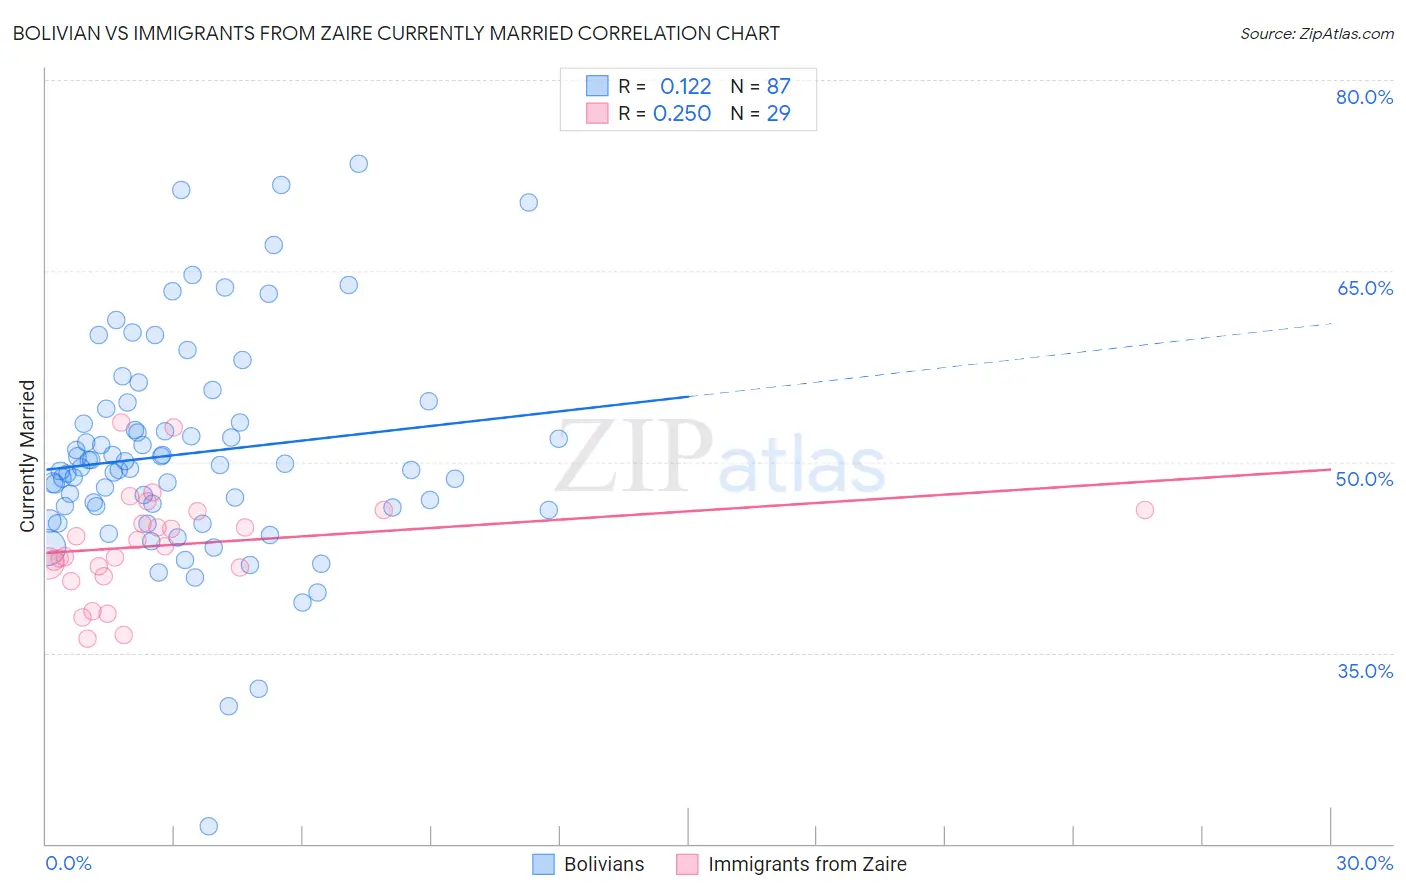
Bolivian vs Immigrants from Zaire Currently Married Correlation Chart
The statistical analysis conducted on geographies consisting of 184,673,558 people shows a poor positive correlation between the proportion of Bolivians and percentage of population currently married in the United States with a correlation coefficient (R) of 0.122 and weighted average of 48.1%. Similarly, the statistical analysis conducted on geographies consisting of 107,251,110 people shows a weak positive correlation between the proportion of Immigrants from Zaire and percentage of population currently married in the United States with a correlation coefficient (R) of 0.250 and weighted average of 42.0%, a difference of 14.6%.
Currently Married Correlation Summary
| Measurement | Bolivian | Immigrants from Zaire |
| Minimum | 21.3% | 36.1% |
| Maximum | 73.4% | 53.1% |
| Range | 52.1% | 16.9% |
| Mean | 50.7% | 43.5% |
| Median | 49.6% | 43.4% |
| Interquartile 25% (IQ1) | 46.4% | 41.4% |
| Interquartile 75% (IQ3) | 54.2% | 46.1% |
| Interquartile Range (IQR) | 7.8% | 4.8% |
| Standard Deviation (Sample) | 8.6% | 4.1% |
| Standard Deviation (Population) | 8.6% | 4.0% |
Similar Demographics by Currently Married
Demographics Similar to Bolivians by Currently Married
In terms of currently married, the demographic groups most similar to Bolivians are Immigrants from Israel (48.1%, a difference of 0.0%), Immigrants from Poland (48.1%, a difference of 0.010%), Immigrants from Sri Lanka (48.1%, a difference of 0.010%), Immigrants from Europe (48.1%, a difference of 0.010%), and Immigrants from South Africa (48.1%, a difference of 0.050%).
| Demographics | Rating | Rank | Currently Married |
| Basques | 97.2 /100 | #76 | Exceptional 48.1% |
| Slovenes | 97.1 /100 | #77 | Exceptional 48.1% |
| Immigrants | Belgium | 97.1 /100 | #78 | Exceptional 48.1% |
| Immigrants | South Africa | 97.0 /100 | #79 | Exceptional 48.1% |
| Immigrants | Poland | 96.9 /100 | #80 | Exceptional 48.1% |
| Immigrants | Sri Lanka | 96.9 /100 | #81 | Exceptional 48.1% |
| Immigrants | Europe | 96.9 /100 | #82 | Exceptional 48.1% |
| Bolivians | 96.9 /100 | #83 | Exceptional 48.1% |
| Immigrants | Israel | 96.9 /100 | #84 | Exceptional 48.1% |
| French Canadians | 96.3 /100 | #85 | Exceptional 48.0% |
| Immigrants | Japan | 96.2 /100 | #86 | Exceptional 48.0% |
| Jordanians | 96.2 /100 | #87 | Exceptional 48.0% |
| Immigrants | Eastern Europe | 96.1 /100 | #88 | Exceptional 48.0% |
| Indians (Asian) | 95.8 /100 | #89 | Exceptional 48.0% |
| Americans | 95.7 /100 | #90 | Exceptional 48.0% |
Demographics Similar to Immigrants from Zaire by Currently Married
In terms of currently married, the demographic groups most similar to Immigrants from Zaire are Sioux (41.9%, a difference of 0.010%), Immigrants from Bahamas (41.9%, a difference of 0.13%), Immigrants from Trinidad and Tobago (41.9%, a difference of 0.16%), Immigrants from Guyana (41.9%, a difference of 0.17%), and Immigrants from Yemen (42.1%, a difference of 0.25%).
| Demographics | Rating | Rank | Currently Married |
| Immigrants | Western Africa | 0.0 /100 | #295 | Tragic 42.4% |
| Menominee | 0.0 /100 | #296 | Tragic 42.3% |
| Cheyenne | 0.0 /100 | #297 | Tragic 42.2% |
| Immigrants | Honduras | 0.0 /100 | #298 | Tragic 42.2% |
| Liberians | 0.0 /100 | #299 | Tragic 42.2% |
| Belizeans | 0.0 /100 | #300 | Tragic 42.2% |
| Immigrants | Yemen | 0.0 /100 | #301 | Tragic 42.1% |
| Immigrants | Zaire | 0.0 /100 | #302 | Tragic 42.0% |
| Sioux | 0.0 /100 | #303 | Tragic 41.9% |
| Immigrants | Bahamas | 0.0 /100 | #304 | Tragic 41.9% |
| Immigrants | Trinidad and Tobago | 0.0 /100 | #305 | Tragic 41.9% |
| Immigrants | Guyana | 0.0 /100 | #306 | Tragic 41.9% |
| Africans | 0.0 /100 | #307 | Tragic 41.8% |
| Immigrants | Belize | 0.0 /100 | #308 | Tragic 41.8% |
| Immigrants | Liberia | 0.0 /100 | #309 | Tragic 41.8% |