Blackfeet vs Immigrants from Kazakhstan Currently Married
COMPARE
Blackfeet
Immigrants from Kazakhstan
Currently Married
Currently Married Comparison
Blackfeet
Immigrants from Kazakhstan
44.2%
CURRENTLY MARRIED
0.3/ 100
METRIC RATING
251st/ 347
METRIC RANK
47.4%
CURRENTLY MARRIED
87.2/ 100
METRIC RATING
123rd/ 347
METRIC RANK
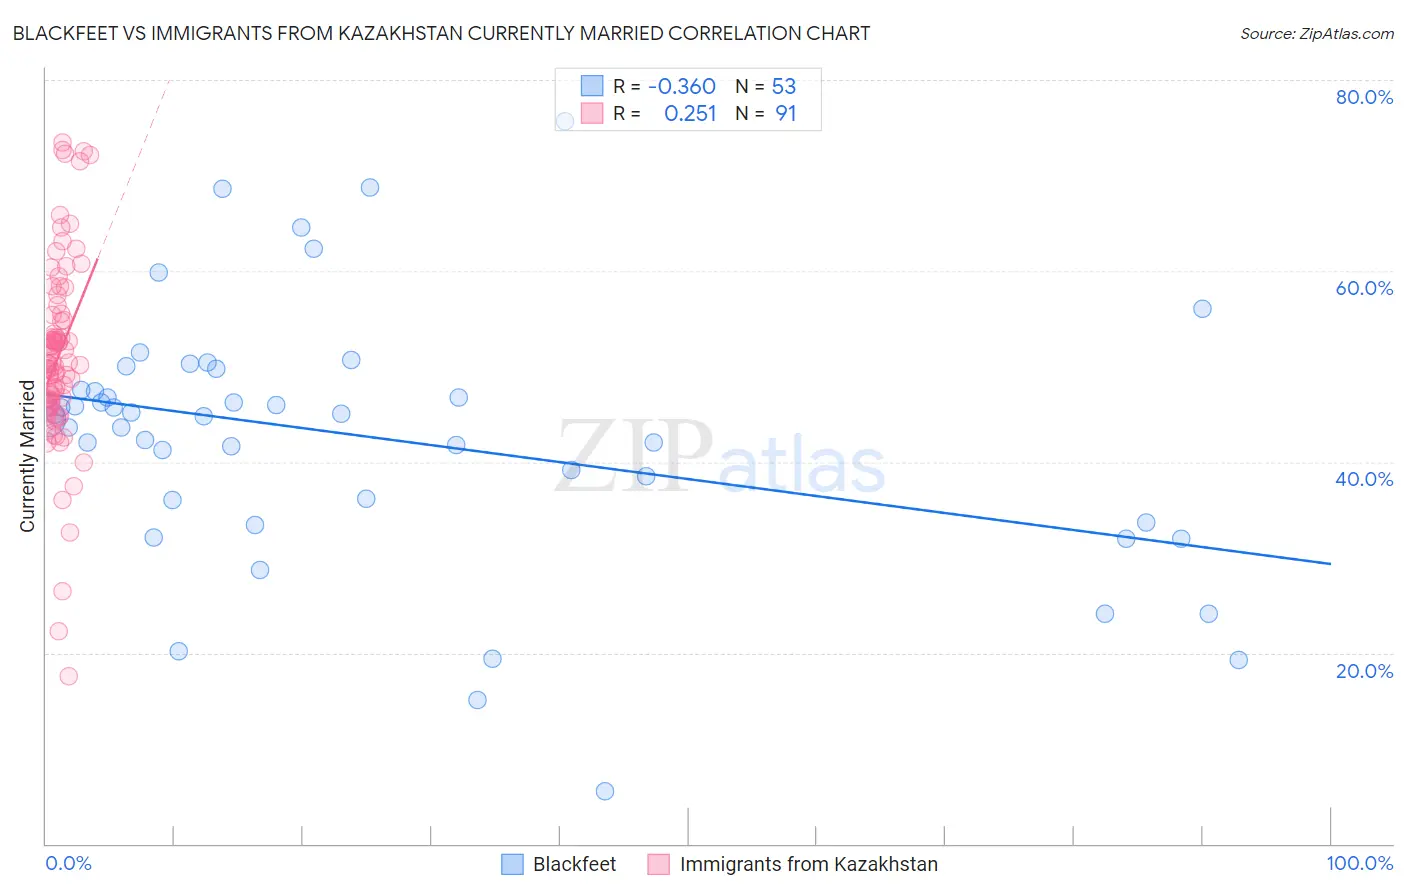
Blackfeet vs Immigrants from Kazakhstan Currently Married Correlation Chart
The statistical analysis conducted on geographies consisting of 309,564,713 people shows a mild negative correlation between the proportion of Blackfeet and percentage of population currently married in the United States with a correlation coefficient (R) of -0.360 and weighted average of 44.2%. Similarly, the statistical analysis conducted on geographies consisting of 124,441,390 people shows a weak positive correlation between the proportion of Immigrants from Kazakhstan and percentage of population currently married in the United States with a correlation coefficient (R) of 0.251 and weighted average of 47.4%, a difference of 7.5%.
Currently Married Correlation Summary
| Measurement | Blackfeet | Immigrants from Kazakhstan |
| Minimum | 5.5% | 17.6% |
| Maximum | 75.7% | 73.4% |
| Range | 70.2% | 55.8% |
| Mean | 42.5% | 51.1% |
| Median | 44.8% | 50.3% |
| Interquartile 25% (IQ1) | 34.9% | 46.3% |
| Interquartile 75% (IQ3) | 48.6% | 55.4% |
| Interquartile Range (IQR) | 13.7% | 9.1% |
| Standard Deviation (Sample) | 13.6% | 9.9% |
| Standard Deviation (Population) | 13.4% | 9.8% |
Similar Demographics by Currently Married
Demographics Similar to Blackfeet by Currently Married
In terms of currently married, the demographic groups most similar to Blackfeet are Hispanic or Latino (44.1%, a difference of 0.020%), Immigrants from Central America (44.1%, a difference of 0.050%), Immigrants from Eastern Africa (44.2%, a difference of 0.060%), Immigrants from Cameroon (44.2%, a difference of 0.080%), and Nicaraguan (44.2%, a difference of 0.10%).
| Demographics | Rating | Rank | Currently Married |
| Japanese | 0.6 /100 | #244 | Tragic 44.5% |
| Immigrants | Armenia | 0.4 /100 | #245 | Tragic 44.3% |
| Immigrants | Burma/Myanmar | 0.4 /100 | #246 | Tragic 44.3% |
| Ugandans | 0.4 /100 | #247 | Tragic 44.2% |
| Nicaraguans | 0.3 /100 | #248 | Tragic 44.2% |
| Immigrants | Cameroon | 0.3 /100 | #249 | Tragic 44.2% |
| Immigrants | Eastern Africa | 0.3 /100 | #250 | Tragic 44.2% |
| Blackfeet | 0.3 /100 | #251 | Tragic 44.2% |
| Hispanics or Latinos | 0.3 /100 | #252 | Tragic 44.1% |
| Immigrants | Central America | 0.3 /100 | #253 | Tragic 44.1% |
| Vietnamese | 0.2 /100 | #254 | Tragic 44.0% |
| Yakama | 0.2 /100 | #255 | Tragic 44.0% |
| Shoshone | 0.2 /100 | #256 | Tragic 44.0% |
| Immigrants | Africa | 0.2 /100 | #257 | Tragic 43.9% |
| Ute | 0.2 /100 | #258 | Tragic 43.9% |
Demographics Similar to Immigrants from Kazakhstan by Currently Married
In terms of currently married, the demographic groups most similar to Immigrants from Kazakhstan are Laotian (47.4%, a difference of 0.050%), Osage (47.5%, a difference of 0.060%), Immigrants from Croatia (47.5%, a difference of 0.12%), Syrian (47.5%, a difference of 0.15%), and Okinawan (47.4%, a difference of 0.15%).
| Demographics | Rating | Rank | Currently Married |
| Palestinians | 90.4 /100 | #116 | Exceptional 47.6% |
| Puget Sound Salish | 90.3 /100 | #117 | Exceptional 47.6% |
| Immigrants | Philippines | 90.2 /100 | #118 | Exceptional 47.6% |
| Australians | 90.2 /100 | #119 | Exceptional 47.6% |
| Syrians | 88.9 /100 | #120 | Excellent 47.5% |
| Immigrants | Croatia | 88.6 /100 | #121 | Excellent 47.5% |
| Osage | 87.9 /100 | #122 | Excellent 47.5% |
| Immigrants | Kazakhstan | 87.2 /100 | #123 | Excellent 47.4% |
| Laotians | 86.6 /100 | #124 | Excellent 47.4% |
| Okinawans | 85.3 /100 | #125 | Excellent 47.4% |
| Immigrants | Jordan | 84.9 /100 | #126 | Excellent 47.4% |
| New Zealanders | 84.9 /100 | #127 | Excellent 47.4% |
| Portuguese | 84.2 /100 | #128 | Excellent 47.3% |
| Sri Lankans | 83.2 /100 | #129 | Excellent 47.3% |
| Immigrants | Iraq | 82.8 /100 | #130 | Excellent 47.3% |