Blackfeet vs Native/Alaskan Currently Married
COMPARE
Blackfeet
Native/Alaskan
Currently Married
Currently Married Comparison
Blackfeet
Natives/Alaskans
44.2%
CURRENTLY MARRIED
0.3/ 100
METRIC RATING
251st/ 347
METRIC RANK
42.8%
CURRENTLY MARRIED
0.0/ 100
METRIC RATING
288th/ 347
METRIC RANK
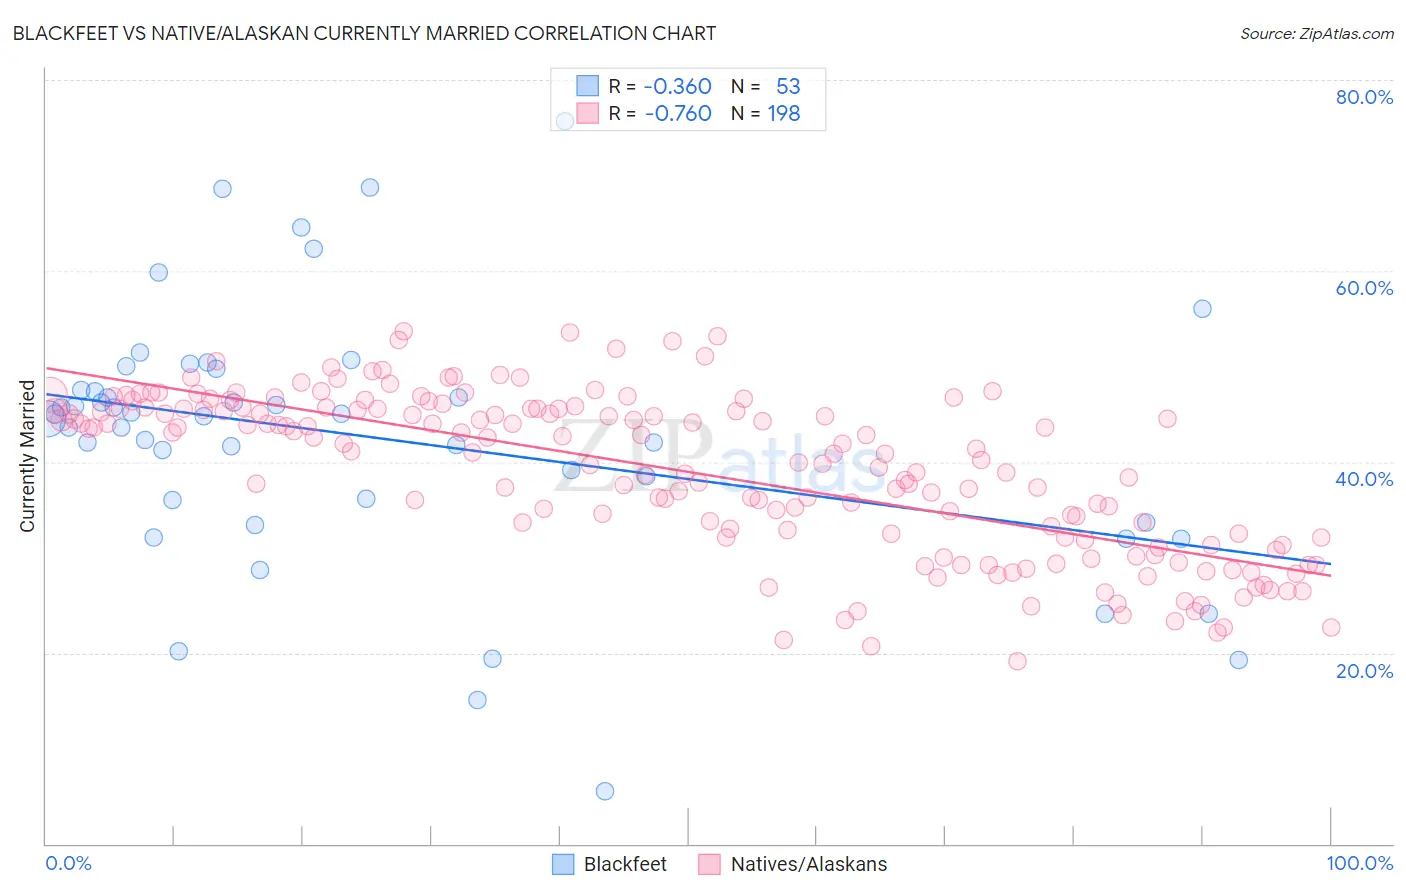
Blackfeet vs Native/Alaskan Currently Married Correlation Chart
The statistical analysis conducted on geographies consisting of 309,564,713 people shows a mild negative correlation between the proportion of Blackfeet and percentage of population currently married in the United States with a correlation coefficient (R) of -0.360 and weighted average of 44.2%. Similarly, the statistical analysis conducted on geographies consisting of 512,977,387 people shows a strong negative correlation between the proportion of Natives/Alaskans and percentage of population currently married in the United States with a correlation coefficient (R) of -0.760 and weighted average of 42.8%, a difference of 3.2%.
Currently Married Correlation Summary
| Measurement | Blackfeet | Native/Alaskan |
| Minimum | 5.5% | 19.1% |
| Maximum | 75.7% | 53.7% |
| Range | 70.2% | 34.6% |
| Mean | 42.5% | 38.9% |
| Median | 44.8% | 41.0% |
| Interquartile 25% (IQ1) | 34.9% | 32.1% |
| Interquartile 75% (IQ3) | 48.6% | 45.5% |
| Interquartile Range (IQR) | 13.7% | 13.5% |
| Standard Deviation (Sample) | 13.6% | 8.3% |
| Standard Deviation (Population) | 13.4% | 8.3% |
Similar Demographics by Currently Married
Demographics Similar to Blackfeet by Currently Married
In terms of currently married, the demographic groups most similar to Blackfeet are Hispanic or Latino (44.1%, a difference of 0.020%), Immigrants from Central America (44.1%, a difference of 0.050%), Immigrants from Eastern Africa (44.2%, a difference of 0.060%), Immigrants from Cameroon (44.2%, a difference of 0.080%), and Nicaraguan (44.2%, a difference of 0.10%).
| Demographics | Rating | Rank | Currently Married |
| Japanese | 0.6 /100 | #244 | Tragic 44.5% |
| Immigrants | Armenia | 0.4 /100 | #245 | Tragic 44.3% |
| Immigrants | Burma/Myanmar | 0.4 /100 | #246 | Tragic 44.3% |
| Ugandans | 0.4 /100 | #247 | Tragic 44.2% |
| Nicaraguans | 0.3 /100 | #248 | Tragic 44.2% |
| Immigrants | Cameroon | 0.3 /100 | #249 | Tragic 44.2% |
| Immigrants | Eastern Africa | 0.3 /100 | #250 | Tragic 44.2% |
| Blackfeet | 0.3 /100 | #251 | Tragic 44.2% |
| Hispanics or Latinos | 0.3 /100 | #252 | Tragic 44.1% |
| Immigrants | Central America | 0.3 /100 | #253 | Tragic 44.1% |
| Vietnamese | 0.2 /100 | #254 | Tragic 44.0% |
| Yakama | 0.2 /100 | #255 | Tragic 44.0% |
| Shoshone | 0.2 /100 | #256 | Tragic 44.0% |
| Immigrants | Africa | 0.2 /100 | #257 | Tragic 43.9% |
| Ute | 0.2 /100 | #258 | Tragic 43.9% |
Demographics Similar to Natives/Alaskans by Currently Married
In terms of currently married, the demographic groups most similar to Natives/Alaskans are Paiute (42.7%, a difference of 0.23%), Immigrants from Ghana (42.7%, a difference of 0.24%), Guatemalan (42.9%, a difference of 0.27%), Ghanaian (42.9%, a difference of 0.29%), and Immigrants from Guatemala (42.6%, a difference of 0.36%).
| Demographics | Rating | Rank | Currently Married |
| Chippewa | 0.0 /100 | #281 | Tragic 43.2% |
| Immigrants | Ecuador | 0.0 /100 | #282 | Tragic 43.2% |
| Kiowa | 0.0 /100 | #283 | Tragic 43.2% |
| Immigrants | El Salvador | 0.0 /100 | #284 | Tragic 43.1% |
| Immigrants | Middle Africa | 0.0 /100 | #285 | Tragic 43.0% |
| Ghanaians | 0.0 /100 | #286 | Tragic 42.9% |
| Guatemalans | 0.0 /100 | #287 | Tragic 42.9% |
| Natives/Alaskans | 0.0 /100 | #288 | Tragic 42.8% |
| Paiute | 0.0 /100 | #289 | Tragic 42.7% |
| Immigrants | Ghana | 0.0 /100 | #290 | Tragic 42.7% |
| Immigrants | Guatemala | 0.0 /100 | #291 | Tragic 42.6% |
| Sub-Saharan Africans | 0.0 /100 | #292 | Tragic 42.6% |
| Yuman | 0.0 /100 | #293 | Tragic 42.6% |
| Hondurans | 0.0 /100 | #294 | Tragic 42.5% |
| Immigrants | Western Africa | 0.0 /100 | #295 | Tragic 42.4% |