Blackfeet vs Choctaw Currently Married
COMPARE
Blackfeet
Choctaw
Currently Married
Currently Married Comparison
Blackfeet
Choctaw
44.2%
CURRENTLY MARRIED
0.3/ 100
METRIC RATING
251st/ 347
METRIC RANK
46.3%
CURRENTLY MARRIED
29.1/ 100
METRIC RATING
190th/ 347
METRIC RANK
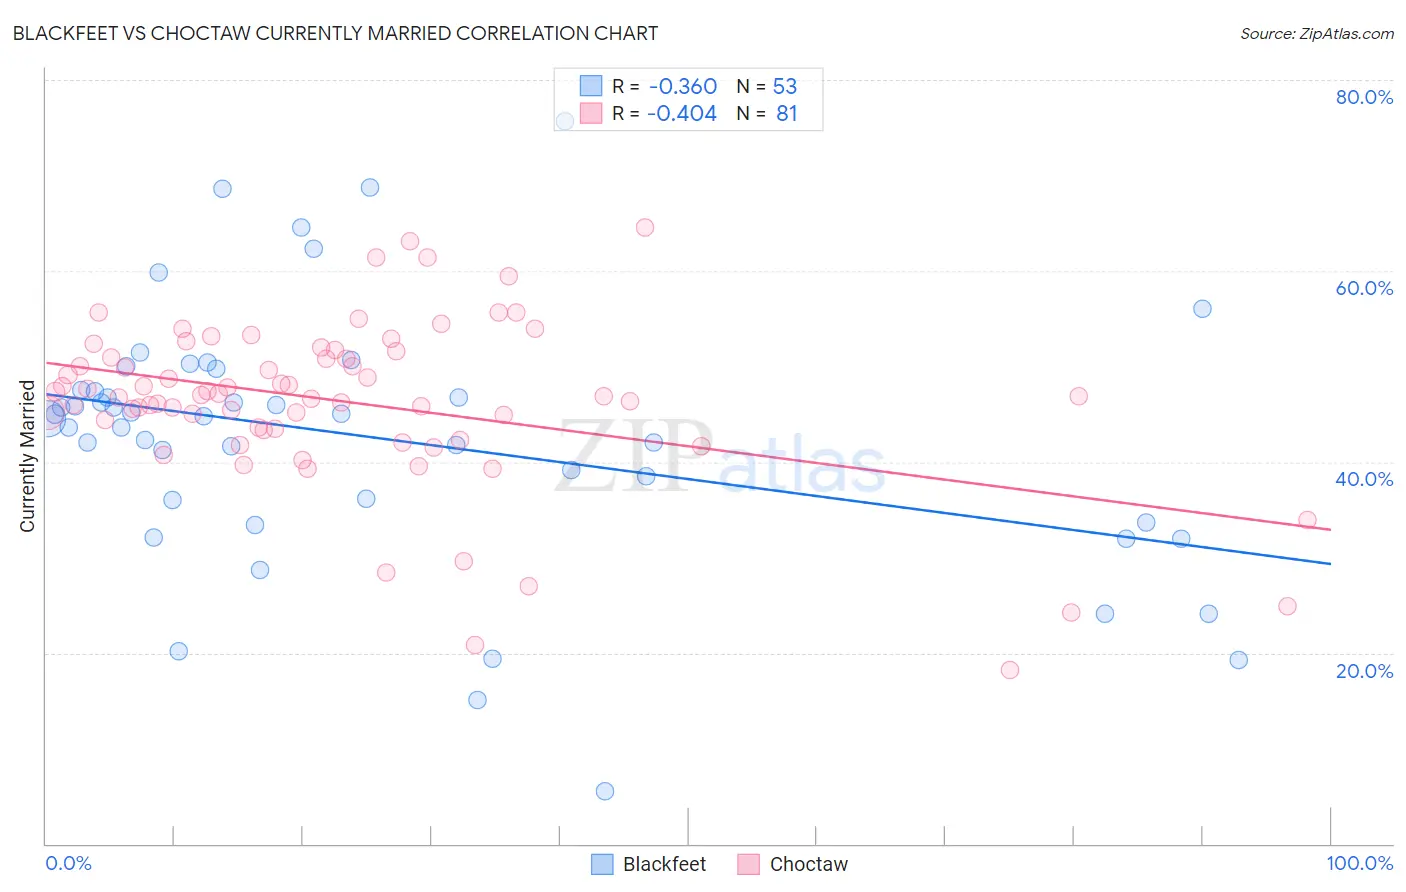
Blackfeet vs Choctaw Currently Married Correlation Chart
The statistical analysis conducted on geographies consisting of 309,564,713 people shows a mild negative correlation between the proportion of Blackfeet and percentage of population currently married in the United States with a correlation coefficient (R) of -0.360 and weighted average of 44.2%. Similarly, the statistical analysis conducted on geographies consisting of 269,717,873 people shows a moderate negative correlation between the proportion of Choctaw and percentage of population currently married in the United States with a correlation coefficient (R) of -0.404 and weighted average of 46.3%, a difference of 4.7%.
Currently Married Correlation Summary
| Measurement | Blackfeet | Choctaw |
| Minimum | 5.5% | 18.2% |
| Maximum | 75.7% | 64.5% |
| Range | 70.2% | 46.3% |
| Mean | 42.5% | 46.2% |
| Median | 44.8% | 46.9% |
| Interquartile 25% (IQ1) | 34.9% | 43.4% |
| Interquartile 75% (IQ3) | 48.6% | 51.3% |
| Interquartile Range (IQR) | 13.7% | 7.9% |
| Standard Deviation (Sample) | 13.6% | 8.8% |
| Standard Deviation (Population) | 13.4% | 8.7% |
Similar Demographics by Currently Married
Demographics Similar to Blackfeet by Currently Married
In terms of currently married, the demographic groups most similar to Blackfeet are Hispanic or Latino (44.1%, a difference of 0.020%), Immigrants from Central America (44.1%, a difference of 0.050%), Immigrants from Eastern Africa (44.2%, a difference of 0.060%), Immigrants from Cameroon (44.2%, a difference of 0.080%), and Nicaraguan (44.2%, a difference of 0.10%).
| Demographics | Rating | Rank | Currently Married |
| Japanese | 0.6 /100 | #244 | Tragic 44.5% |
| Immigrants | Armenia | 0.4 /100 | #245 | Tragic 44.3% |
| Immigrants | Burma/Myanmar | 0.4 /100 | #246 | Tragic 44.3% |
| Ugandans | 0.4 /100 | #247 | Tragic 44.2% |
| Nicaraguans | 0.3 /100 | #248 | Tragic 44.2% |
| Immigrants | Cameroon | 0.3 /100 | #249 | Tragic 44.2% |
| Immigrants | Eastern Africa | 0.3 /100 | #250 | Tragic 44.2% |
| Blackfeet | 0.3 /100 | #251 | Tragic 44.2% |
| Hispanics or Latinos | 0.3 /100 | #252 | Tragic 44.1% |
| Immigrants | Central America | 0.3 /100 | #253 | Tragic 44.1% |
| Vietnamese | 0.2 /100 | #254 | Tragic 44.0% |
| Yakama | 0.2 /100 | #255 | Tragic 44.0% |
| Shoshone | 0.2 /100 | #256 | Tragic 44.0% |
| Immigrants | Africa | 0.2 /100 | #257 | Tragic 43.9% |
| Ute | 0.2 /100 | #258 | Tragic 43.9% |
Demographics Similar to Choctaw by Currently Married
In terms of currently married, the demographic groups most similar to Choctaw are Fijian (46.3%, a difference of 0.050%), Immigrants from France (46.2%, a difference of 0.060%), Colombian (46.3%, a difference of 0.12%), Soviet Union (46.2%, a difference of 0.16%), and Immigrants from Fiji (46.2%, a difference of 0.19%).
| Demographics | Rating | Rank | Currently Married |
| Immigrants | Northern Africa | 39.7 /100 | #183 | Fair 46.5% |
| Brazilians | 39.3 /100 | #184 | Fair 46.4% |
| Mongolians | 37.6 /100 | #185 | Fair 46.4% |
| Immigrants | Chile | 36.8 /100 | #186 | Fair 46.4% |
| Immigrants | Peru | 35.3 /100 | #187 | Fair 46.4% |
| Colombians | 31.8 /100 | #188 | Fair 46.3% |
| Fijians | 30.3 /100 | #189 | Fair 46.3% |
| Choctaw | 29.1 /100 | #190 | Fair 46.3% |
| Immigrants | France | 27.7 /100 | #191 | Fair 46.2% |
| Soviet Union | 25.7 /100 | #192 | Fair 46.2% |
| Immigrants | Fiji | 25.0 /100 | #193 | Fair 46.2% |
| South Americans | 23.8 /100 | #194 | Fair 46.1% |
| Immigrants | Nepal | 23.7 /100 | #195 | Fair 46.1% |
| Immigrants | Bosnia and Herzegovina | 22.2 /100 | #196 | Fair 46.1% |
| Immigrants | Kuwait | 21.7 /100 | #197 | Fair 46.1% |