Thai vs Immigrants from Zaire Currently Married
COMPARE
Thai
Immigrants from Zaire
Currently Married
Currently Married Comparison
Thais
Immigrants from Zaire
50.9%
CURRENTLY MARRIED
100.0/ 100
METRIC RATING
2nd/ 347
METRIC RANK
42.0%
CURRENTLY MARRIED
0.0/ 100
METRIC RATING
302nd/ 347
METRIC RANK
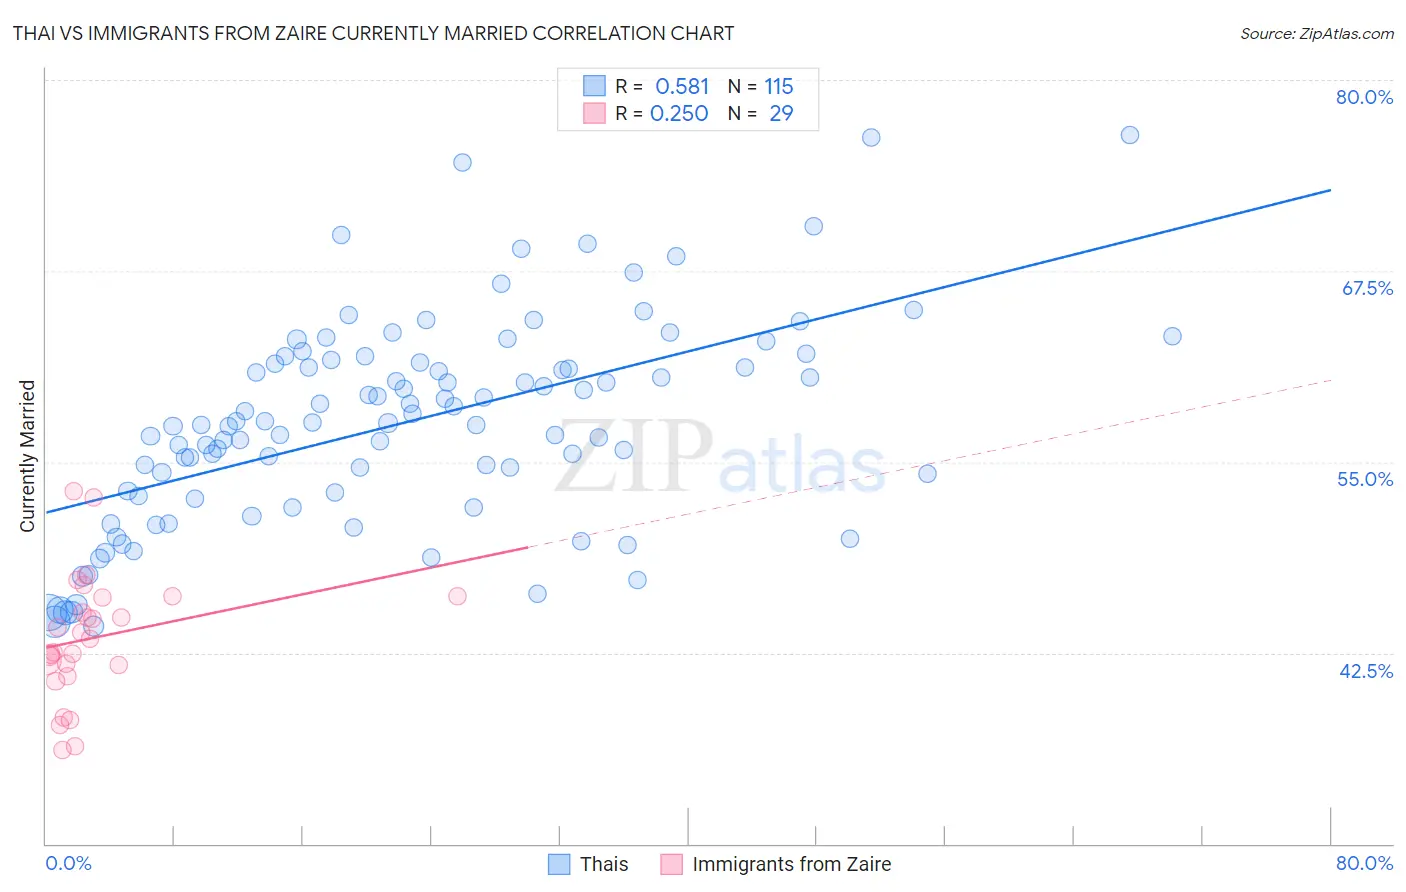
Thai vs Immigrants from Zaire Currently Married Correlation Chart
The statistical analysis conducted on geographies consisting of 475,756,416 people shows a substantial positive correlation between the proportion of Thais and percentage of population currently married in the United States with a correlation coefficient (R) of 0.581 and weighted average of 50.9%. Similarly, the statistical analysis conducted on geographies consisting of 107,251,110 people shows a weak positive correlation between the proportion of Immigrants from Zaire and percentage of population currently married in the United States with a correlation coefficient (R) of 0.250 and weighted average of 42.0%, a difference of 21.2%.
Currently Married Correlation Summary
| Measurement | Thai | Immigrants from Zaire |
| Minimum | 44.3% | 36.1% |
| Maximum | 76.4% | 53.1% |
| Range | 32.1% | 16.9% |
| Mean | 57.5% | 43.5% |
| Median | 57.5% | 43.4% |
| Interquartile 25% (IQ1) | 52.8% | 41.4% |
| Interquartile 75% (IQ3) | 61.5% | 46.1% |
| Interquartile Range (IQR) | 8.7% | 4.8% |
| Standard Deviation (Sample) | 6.8% | 4.1% |
| Standard Deviation (Population) | 6.8% | 4.0% |
Similar Demographics by Currently Married
Demographics Similar to Thais by Currently Married
In terms of currently married, the demographic groups most similar to Thais are Assyrian/Chaldean/Syriac (50.8%, a difference of 0.18%), Immigrants from Taiwan (50.7%, a difference of 0.26%), Danish (50.5%, a difference of 0.81%), Norwegian (50.2%, a difference of 1.4%), and Immigrants from South Central Asia (50.0%, a difference of 1.7%).
| Demographics | Rating | Rank | Currently Married |
| Immigrants | India | 100.0 /100 | #1 | Exceptional 51.8% |
| Thais | 100.0 /100 | #2 | Exceptional 50.9% |
| Assyrians/Chaldeans/Syriacs | 100.0 /100 | #3 | Exceptional 50.8% |
| Immigrants | Taiwan | 100.0 /100 | #4 | Exceptional 50.7% |
| Danes | 100.0 /100 | #5 | Exceptional 50.5% |
| Norwegians | 100.0 /100 | #6 | Exceptional 50.2% |
| Immigrants | South Central Asia | 100.0 /100 | #7 | Exceptional 50.0% |
| Swedes | 100.0 /100 | #8 | Exceptional 50.0% |
| Czechs | 99.9 /100 | #9 | Exceptional 49.9% |
| Filipinos | 99.9 /100 | #10 | Exceptional 49.7% |
| English | 99.9 /100 | #11 | Exceptional 49.7% |
| Swiss | 99.9 /100 | #12 | Exceptional 49.7% |
| Dutch | 99.9 /100 | #13 | Exceptional 49.6% |
| Germans | 99.9 /100 | #14 | Exceptional 49.6% |
| Pennsylvania Germans | 99.9 /100 | #15 | Exceptional 49.6% |
Demographics Similar to Immigrants from Zaire by Currently Married
In terms of currently married, the demographic groups most similar to Immigrants from Zaire are Sioux (41.9%, a difference of 0.010%), Immigrants from Bahamas (41.9%, a difference of 0.13%), Immigrants from Trinidad and Tobago (41.9%, a difference of 0.16%), Immigrants from Guyana (41.9%, a difference of 0.17%), and Immigrants from Yemen (42.1%, a difference of 0.25%).
| Demographics | Rating | Rank | Currently Married |
| Immigrants | Western Africa | 0.0 /100 | #295 | Tragic 42.4% |
| Menominee | 0.0 /100 | #296 | Tragic 42.3% |
| Cheyenne | 0.0 /100 | #297 | Tragic 42.2% |
| Immigrants | Honduras | 0.0 /100 | #298 | Tragic 42.2% |
| Liberians | 0.0 /100 | #299 | Tragic 42.2% |
| Belizeans | 0.0 /100 | #300 | Tragic 42.2% |
| Immigrants | Yemen | 0.0 /100 | #301 | Tragic 42.1% |
| Immigrants | Zaire | 0.0 /100 | #302 | Tragic 42.0% |
| Sioux | 0.0 /100 | #303 | Tragic 41.9% |
| Immigrants | Bahamas | 0.0 /100 | #304 | Tragic 41.9% |
| Immigrants | Trinidad and Tobago | 0.0 /100 | #305 | Tragic 41.9% |
| Immigrants | Guyana | 0.0 /100 | #306 | Tragic 41.9% |
| Africans | 0.0 /100 | #307 | Tragic 41.8% |
| Immigrants | Belize | 0.0 /100 | #308 | Tragic 41.8% |
| Immigrants | Liberia | 0.0 /100 | #309 | Tragic 41.8% |