Romanian vs Immigrants from Zaire Currently Married
COMPARE
Romanian
Immigrants from Zaire
Currently Married
Currently Married Comparison
Romanians
Immigrants from Zaire
48.4%
CURRENTLY MARRIED
98.5/ 100
METRIC RATING
61st/ 347
METRIC RANK
42.0%
CURRENTLY MARRIED
0.0/ 100
METRIC RATING
302nd/ 347
METRIC RANK
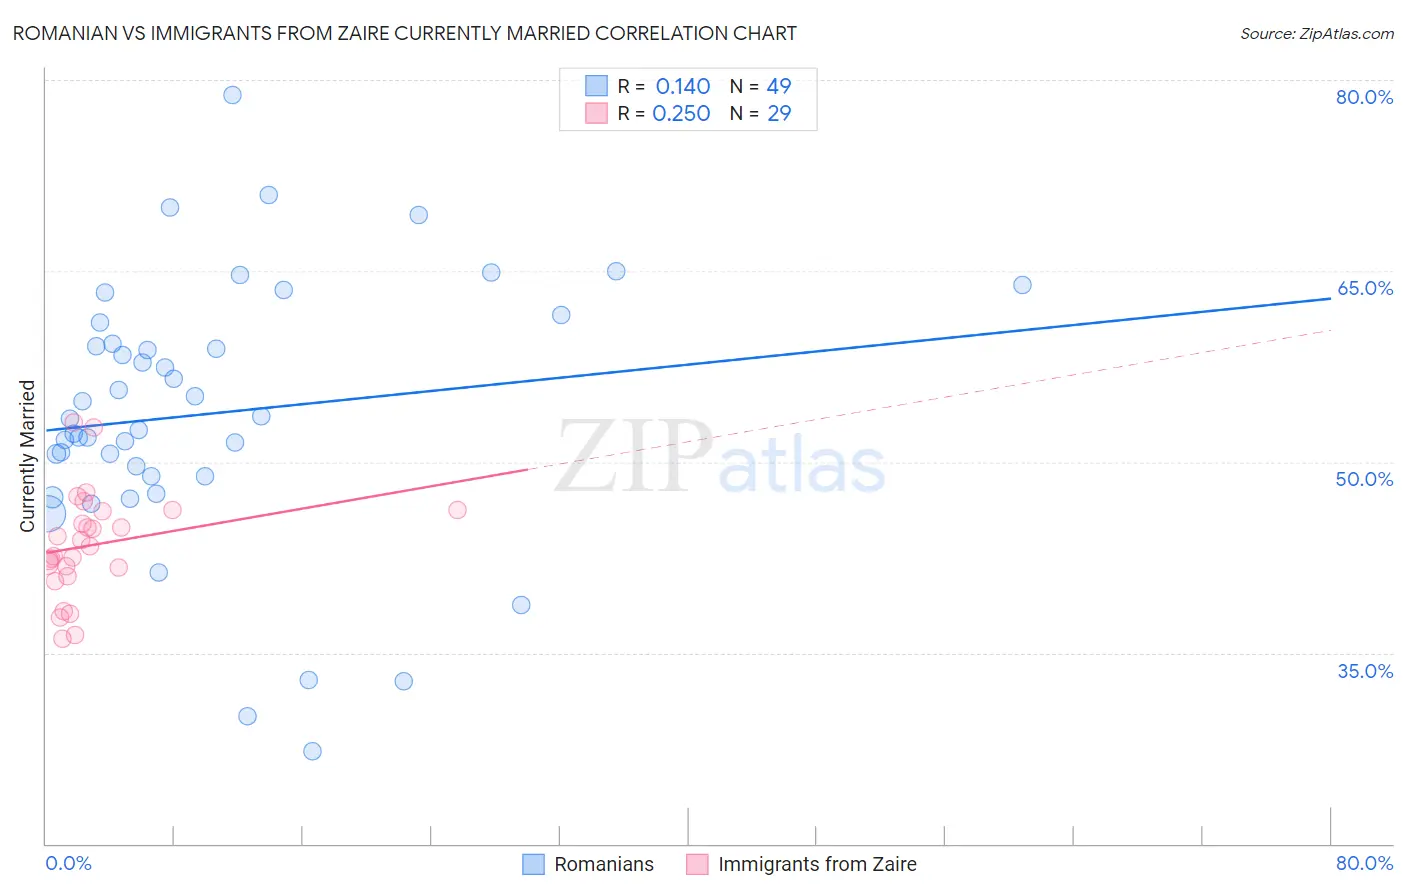
Romanian vs Immigrants from Zaire Currently Married Correlation Chart
The statistical analysis conducted on geographies consisting of 377,883,259 people shows a poor positive correlation between the proportion of Romanians and percentage of population currently married in the United States with a correlation coefficient (R) of 0.140 and weighted average of 48.4%. Similarly, the statistical analysis conducted on geographies consisting of 107,251,110 people shows a weak positive correlation between the proportion of Immigrants from Zaire and percentage of population currently married in the United States with a correlation coefficient (R) of 0.250 and weighted average of 42.0%, a difference of 15.4%.
Currently Married Correlation Summary
| Measurement | Romanian | Immigrants from Zaire |
| Minimum | 27.3% | 36.1% |
| Maximum | 78.8% | 53.1% |
| Range | 51.5% | 16.9% |
| Mean | 53.8% | 43.5% |
| Median | 53.4% | 43.4% |
| Interquartile 25% (IQ1) | 48.9% | 41.4% |
| Interquartile 75% (IQ3) | 60.1% | 46.1% |
| Interquartile Range (IQR) | 11.2% | 4.8% |
| Standard Deviation (Sample) | 10.5% | 4.1% |
| Standard Deviation (Population) | 10.4% | 4.0% |
Similar Demographics by Currently Married
Demographics Similar to Romanians by Currently Married
In terms of currently married, the demographic groups most similar to Romanians are Asian (48.4%, a difference of 0.0%), Immigrants from Romania (48.4%, a difference of 0.010%), Immigrants from Ireland (48.4%, a difference of 0.030%), French (48.4%, a difference of 0.050%), and Immigrants from Netherlands (48.5%, a difference of 0.10%).
| Demographics | Rating | Rank | Currently Married |
| Immigrants | Moldova | 98.7 /100 | #54 | Exceptional 48.5% |
| Immigrants | North Macedonia | 98.7 /100 | #55 | Exceptional 48.5% |
| Latvians | 98.7 /100 | #56 | Exceptional 48.5% |
| Immigrants | Netherlands | 98.6 /100 | #57 | Exceptional 48.5% |
| French | 98.6 /100 | #58 | Exceptional 48.4% |
| Immigrants | Ireland | 98.5 /100 | #59 | Exceptional 48.4% |
| Immigrants | Romania | 98.5 /100 | #60 | Exceptional 48.4% |
| Romanians | 98.5 /100 | #61 | Exceptional 48.4% |
| Asians | 98.5 /100 | #62 | Exceptional 48.4% |
| Slavs | 98.3 /100 | #63 | Exceptional 48.4% |
| Immigrants | Czechoslovakia | 98.3 /100 | #64 | Exceptional 48.4% |
| Ukrainians | 98.3 /100 | #65 | Exceptional 48.4% |
| Tongans | 98.2 /100 | #66 | Exceptional 48.3% |
| Slovaks | 98.2 /100 | #67 | Exceptional 48.3% |
| Immigrants | England | 98.2 /100 | #68 | Exceptional 48.3% |
Demographics Similar to Immigrants from Zaire by Currently Married
In terms of currently married, the demographic groups most similar to Immigrants from Zaire are Sioux (41.9%, a difference of 0.010%), Immigrants from Bahamas (41.9%, a difference of 0.13%), Immigrants from Trinidad and Tobago (41.9%, a difference of 0.16%), Immigrants from Guyana (41.9%, a difference of 0.17%), and Immigrants from Yemen (42.1%, a difference of 0.25%).
| Demographics | Rating | Rank | Currently Married |
| Immigrants | Western Africa | 0.0 /100 | #295 | Tragic 42.4% |
| Menominee | 0.0 /100 | #296 | Tragic 42.3% |
| Cheyenne | 0.0 /100 | #297 | Tragic 42.2% |
| Immigrants | Honduras | 0.0 /100 | #298 | Tragic 42.2% |
| Liberians | 0.0 /100 | #299 | Tragic 42.2% |
| Belizeans | 0.0 /100 | #300 | Tragic 42.2% |
| Immigrants | Yemen | 0.0 /100 | #301 | Tragic 42.1% |
| Immigrants | Zaire | 0.0 /100 | #302 | Tragic 42.0% |
| Sioux | 0.0 /100 | #303 | Tragic 41.9% |
| Immigrants | Bahamas | 0.0 /100 | #304 | Tragic 41.9% |
| Immigrants | Trinidad and Tobago | 0.0 /100 | #305 | Tragic 41.9% |
| Immigrants | Guyana | 0.0 /100 | #306 | Tragic 41.9% |
| Africans | 0.0 /100 | #307 | Tragic 41.8% |
| Immigrants | Belize | 0.0 /100 | #308 | Tragic 41.8% |
| Immigrants | Liberia | 0.0 /100 | #309 | Tragic 41.8% |