Iranian vs Immigrants from Zaire Currently Married
COMPARE
Iranian
Immigrants from Zaire
Currently Married
Currently Married Comparison
Iranians
Immigrants from Zaire
48.6%
CURRENTLY MARRIED
99.0/ 100
METRIC RATING
50th/ 347
METRIC RANK
42.0%
CURRENTLY MARRIED
0.0/ 100
METRIC RATING
302nd/ 347
METRIC RANK
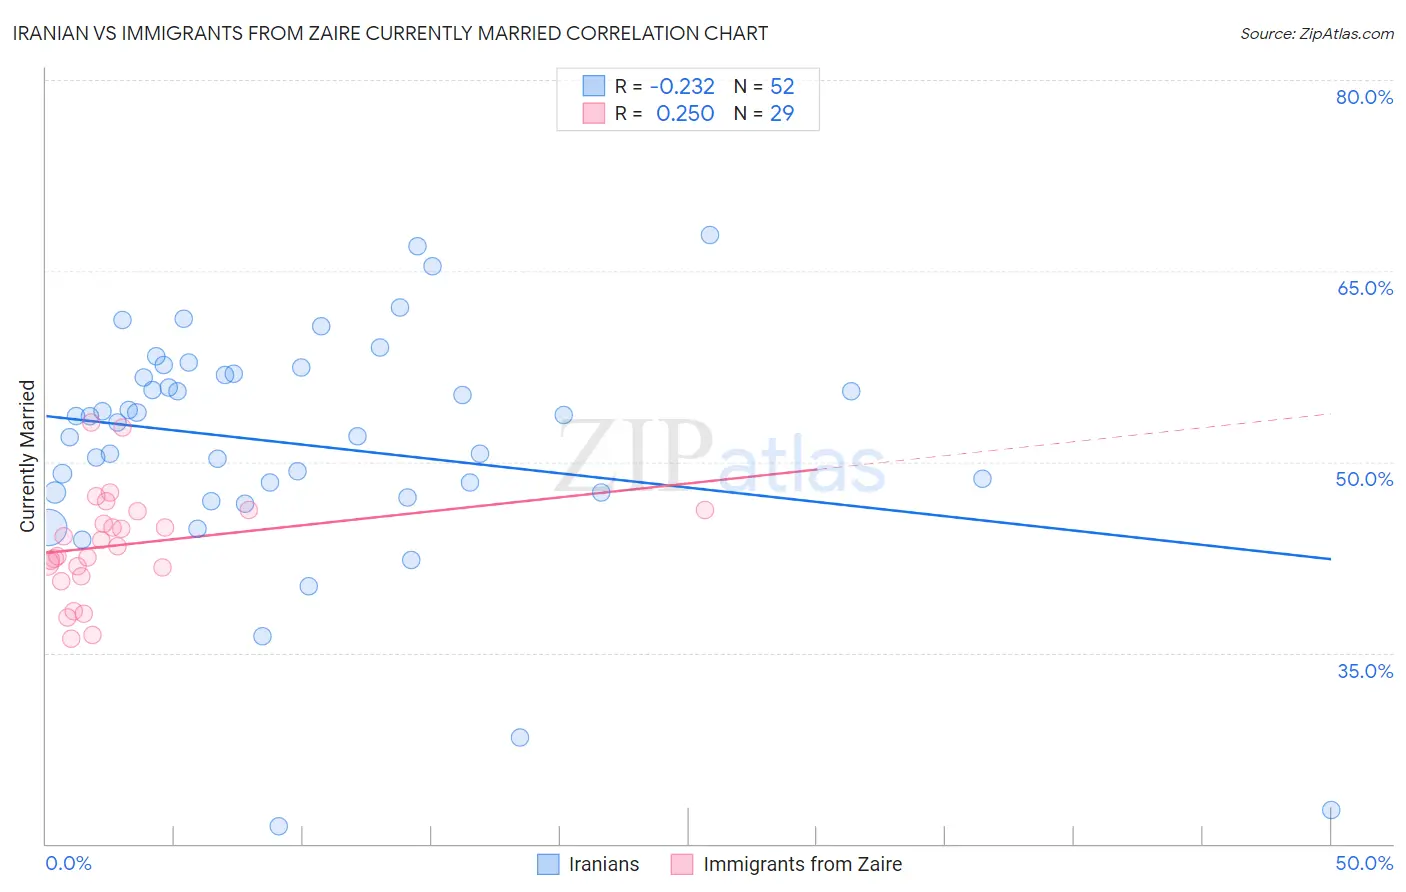
Iranian vs Immigrants from Zaire Currently Married Correlation Chart
The statistical analysis conducted on geographies consisting of 316,855,418 people shows a weak negative correlation between the proportion of Iranians and percentage of population currently married in the United States with a correlation coefficient (R) of -0.232 and weighted average of 48.6%. Similarly, the statistical analysis conducted on geographies consisting of 107,251,110 people shows a weak positive correlation between the proportion of Immigrants from Zaire and percentage of population currently married in the United States with a correlation coefficient (R) of 0.250 and weighted average of 42.0%, a difference of 15.9%.
Currently Married Correlation Summary
| Measurement | Iranian | Immigrants from Zaire |
| Minimum | 21.4% | 36.1% |
| Maximum | 67.8% | 53.1% |
| Range | 46.4% | 16.9% |
| Mean | 51.3% | 43.5% |
| Median | 53.3% | 43.4% |
| Interquartile 25% (IQ1) | 47.6% | 41.4% |
| Interquartile 75% (IQ3) | 56.9% | 46.1% |
| Interquartile Range (IQR) | 9.3% | 4.8% |
| Standard Deviation (Sample) | 9.4% | 4.1% |
| Standard Deviation (Population) | 9.3% | 4.0% |
Similar Demographics by Currently Married
Demographics Similar to Iranians by Currently Married
In terms of currently married, the demographic groups most similar to Iranians are White/Caucasian (48.6%, a difference of 0.010%), Bhutanese (48.6%, a difference of 0.060%), Russian (48.6%, a difference of 0.090%), Austrian (48.7%, a difference of 0.19%), and Immigrants from Iran (48.7%, a difference of 0.21%).
| Demographics | Rating | Rank | Currently Married |
| Scotch-Irish | 99.3 /100 | #43 | Exceptional 48.7% |
| Immigrants | North America | 99.3 /100 | #44 | Exceptional 48.7% |
| Belgians | 99.3 /100 | #45 | Exceptional 48.7% |
| Immigrants | Iran | 99.2 /100 | #46 | Exceptional 48.7% |
| Northern Europeans | 99.2 /100 | #47 | Exceptional 48.7% |
| Austrians | 99.2 /100 | #48 | Exceptional 48.7% |
| Bhutanese | 99.1 /100 | #49 | Exceptional 48.6% |
| Iranians | 99.0 /100 | #50 | Exceptional 48.6% |
| Whites/Caucasians | 99.0 /100 | #51 | Exceptional 48.6% |
| Russians | 98.9 /100 | #52 | Exceptional 48.6% |
| Immigrants | Austria | 98.8 /100 | #53 | Exceptional 48.5% |
| Immigrants | Moldova | 98.7 /100 | #54 | Exceptional 48.5% |
| Immigrants | North Macedonia | 98.7 /100 | #55 | Exceptional 48.5% |
| Latvians | 98.7 /100 | #56 | Exceptional 48.5% |
| Immigrants | Netherlands | 98.6 /100 | #57 | Exceptional 48.5% |
Demographics Similar to Immigrants from Zaire by Currently Married
In terms of currently married, the demographic groups most similar to Immigrants from Zaire are Sioux (41.9%, a difference of 0.010%), Immigrants from Bahamas (41.9%, a difference of 0.13%), Immigrants from Trinidad and Tobago (41.9%, a difference of 0.16%), Immigrants from Guyana (41.9%, a difference of 0.17%), and Immigrants from Yemen (42.1%, a difference of 0.25%).
| Demographics | Rating | Rank | Currently Married |
| Immigrants | Western Africa | 0.0 /100 | #295 | Tragic 42.4% |
| Menominee | 0.0 /100 | #296 | Tragic 42.3% |
| Cheyenne | 0.0 /100 | #297 | Tragic 42.2% |
| Immigrants | Honduras | 0.0 /100 | #298 | Tragic 42.2% |
| Liberians | 0.0 /100 | #299 | Tragic 42.2% |
| Belizeans | 0.0 /100 | #300 | Tragic 42.2% |
| Immigrants | Yemen | 0.0 /100 | #301 | Tragic 42.1% |
| Immigrants | Zaire | 0.0 /100 | #302 | Tragic 42.0% |
| Sioux | 0.0 /100 | #303 | Tragic 41.9% |
| Immigrants | Bahamas | 0.0 /100 | #304 | Tragic 41.9% |
| Immigrants | Trinidad and Tobago | 0.0 /100 | #305 | Tragic 41.9% |
| Immigrants | Guyana | 0.0 /100 | #306 | Tragic 41.9% |
| Africans | 0.0 /100 | #307 | Tragic 41.8% |
| Immigrants | Belize | 0.0 /100 | #308 | Tragic 41.8% |
| Immigrants | Liberia | 0.0 /100 | #309 | Tragic 41.8% |