Blackfeet vs Immigrants from Europe Currently Married
COMPARE
Blackfeet
Immigrants from Europe
Currently Married
Currently Married Comparison
Blackfeet
Immigrants from Europe
44.2%
CURRENTLY MARRIED
0.3/ 100
METRIC RATING
251st/ 347
METRIC RANK
48.1%
CURRENTLY MARRIED
96.9/ 100
METRIC RATING
82nd/ 347
METRIC RANK
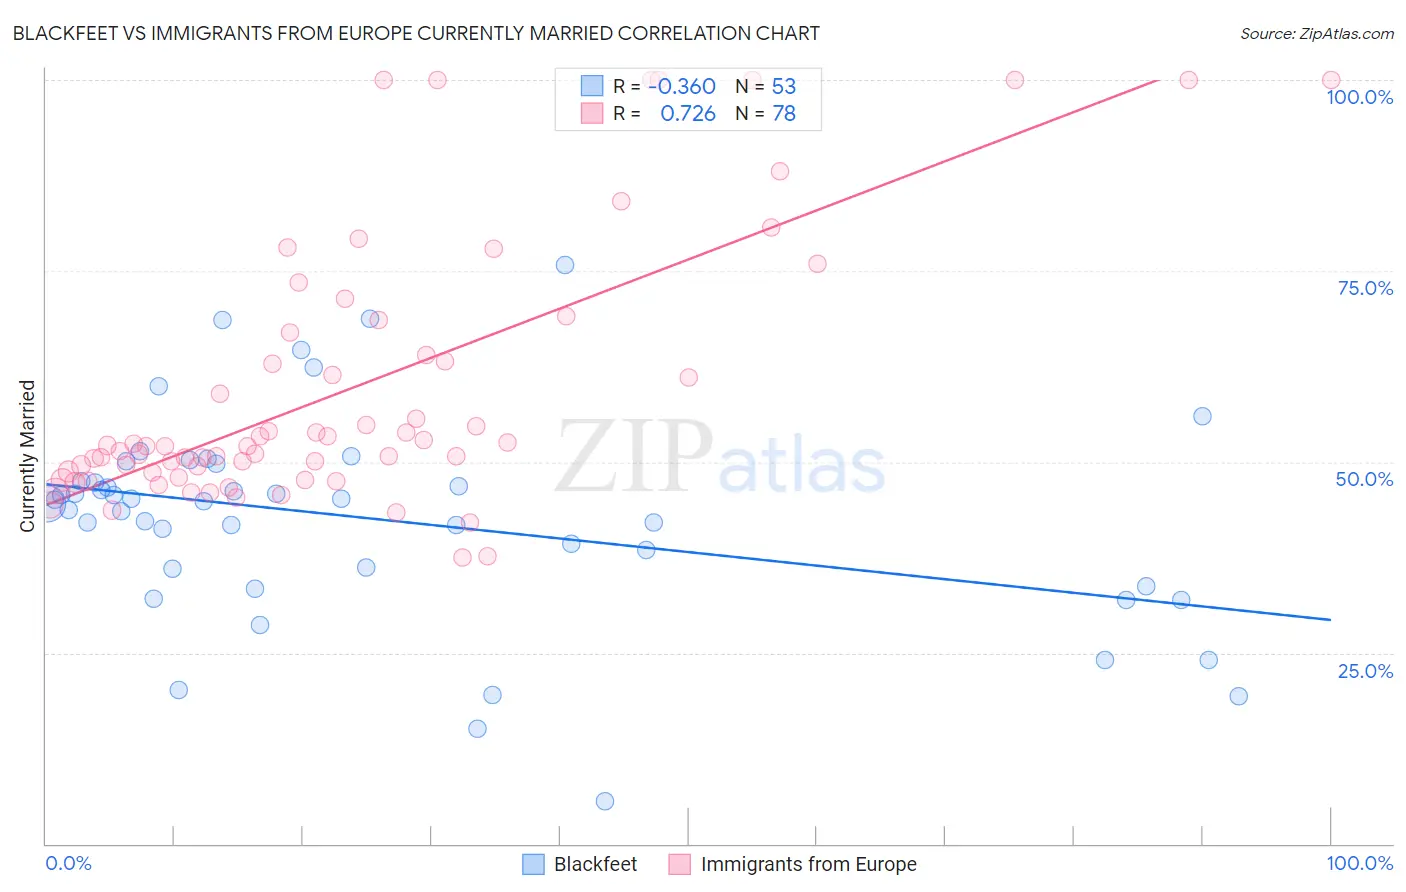
Blackfeet vs Immigrants from Europe Currently Married Correlation Chart
The statistical analysis conducted on geographies consisting of 309,564,713 people shows a mild negative correlation between the proportion of Blackfeet and percentage of population currently married in the United States with a correlation coefficient (R) of -0.360 and weighted average of 44.2%. Similarly, the statistical analysis conducted on geographies consisting of 547,318,007 people shows a strong positive correlation between the proportion of Immigrants from Europe and percentage of population currently married in the United States with a correlation coefficient (R) of 0.726 and weighted average of 48.1%, a difference of 8.9%.
Currently Married Correlation Summary
| Measurement | Blackfeet | Immigrants from Europe |
| Minimum | 5.5% | 37.5% |
| Maximum | 75.7% | 100.0% |
| Range | 70.2% | 62.5% |
| Mean | 42.5% | 59.6% |
| Median | 44.8% | 52.1% |
| Interquartile 25% (IQ1) | 34.9% | 48.6% |
| Interquartile 75% (IQ3) | 48.6% | 66.9% |
| Interquartile Range (IQR) | 13.7% | 18.3% |
| Standard Deviation (Sample) | 13.6% | 17.4% |
| Standard Deviation (Population) | 13.4% | 17.3% |
Similar Demographics by Currently Married
Demographics Similar to Blackfeet by Currently Married
In terms of currently married, the demographic groups most similar to Blackfeet are Hispanic or Latino (44.1%, a difference of 0.020%), Immigrants from Central America (44.1%, a difference of 0.050%), Immigrants from Eastern Africa (44.2%, a difference of 0.060%), Immigrants from Cameroon (44.2%, a difference of 0.080%), and Nicaraguan (44.2%, a difference of 0.10%).
| Demographics | Rating | Rank | Currently Married |
| Japanese | 0.6 /100 | #244 | Tragic 44.5% |
| Immigrants | Armenia | 0.4 /100 | #245 | Tragic 44.3% |
| Immigrants | Burma/Myanmar | 0.4 /100 | #246 | Tragic 44.3% |
| Ugandans | 0.4 /100 | #247 | Tragic 44.2% |
| Nicaraguans | 0.3 /100 | #248 | Tragic 44.2% |
| Immigrants | Cameroon | 0.3 /100 | #249 | Tragic 44.2% |
| Immigrants | Eastern Africa | 0.3 /100 | #250 | Tragic 44.2% |
| Blackfeet | 0.3 /100 | #251 | Tragic 44.2% |
| Hispanics or Latinos | 0.3 /100 | #252 | Tragic 44.1% |
| Immigrants | Central America | 0.3 /100 | #253 | Tragic 44.1% |
| Vietnamese | 0.2 /100 | #254 | Tragic 44.0% |
| Yakama | 0.2 /100 | #255 | Tragic 44.0% |
| Shoshone | 0.2 /100 | #256 | Tragic 44.0% |
| Immigrants | Africa | 0.2 /100 | #257 | Tragic 43.9% |
| Ute | 0.2 /100 | #258 | Tragic 43.9% |
Demographics Similar to Immigrants from Europe by Currently Married
In terms of currently married, the demographic groups most similar to Immigrants from Europe are Immigrants from Sri Lanka (48.1%, a difference of 0.0%), Immigrants from Poland (48.1%, a difference of 0.010%), Bolivian (48.1%, a difference of 0.010%), Immigrants from Israel (48.1%, a difference of 0.010%), and Immigrants from South Africa (48.1%, a difference of 0.040%).
| Demographics | Rating | Rank | Currently Married |
| Immigrants | Belarus | 97.2 /100 | #75 | Exceptional 48.1% |
| Basques | 97.2 /100 | #76 | Exceptional 48.1% |
| Slovenes | 97.1 /100 | #77 | Exceptional 48.1% |
| Immigrants | Belgium | 97.1 /100 | #78 | Exceptional 48.1% |
| Immigrants | South Africa | 97.0 /100 | #79 | Exceptional 48.1% |
| Immigrants | Poland | 96.9 /100 | #80 | Exceptional 48.1% |
| Immigrants | Sri Lanka | 96.9 /100 | #81 | Exceptional 48.1% |
| Immigrants | Europe | 96.9 /100 | #82 | Exceptional 48.1% |
| Bolivians | 96.9 /100 | #83 | Exceptional 48.1% |
| Immigrants | Israel | 96.9 /100 | #84 | Exceptional 48.1% |
| French Canadians | 96.3 /100 | #85 | Exceptional 48.0% |
| Immigrants | Japan | 96.2 /100 | #86 | Exceptional 48.0% |
| Jordanians | 96.2 /100 | #87 | Exceptional 48.0% |
| Immigrants | Eastern Europe | 96.1 /100 | #88 | Exceptional 48.0% |
| Indians (Asian) | 95.8 /100 | #89 | Exceptional 48.0% |