Bhutanese vs Immigrants from Syria Currently Married
COMPARE
Bhutanese
Immigrants from Syria
Currently Married
Currently Married Comparison
Bhutanese
Immigrants from Syria
48.6%
CURRENTLY MARRIED
99.1/ 100
METRIC RATING
49th/ 347
METRIC RANK
46.8%
CURRENTLY MARRIED
59.3/ 100
METRIC RATING
166th/ 347
METRIC RANK
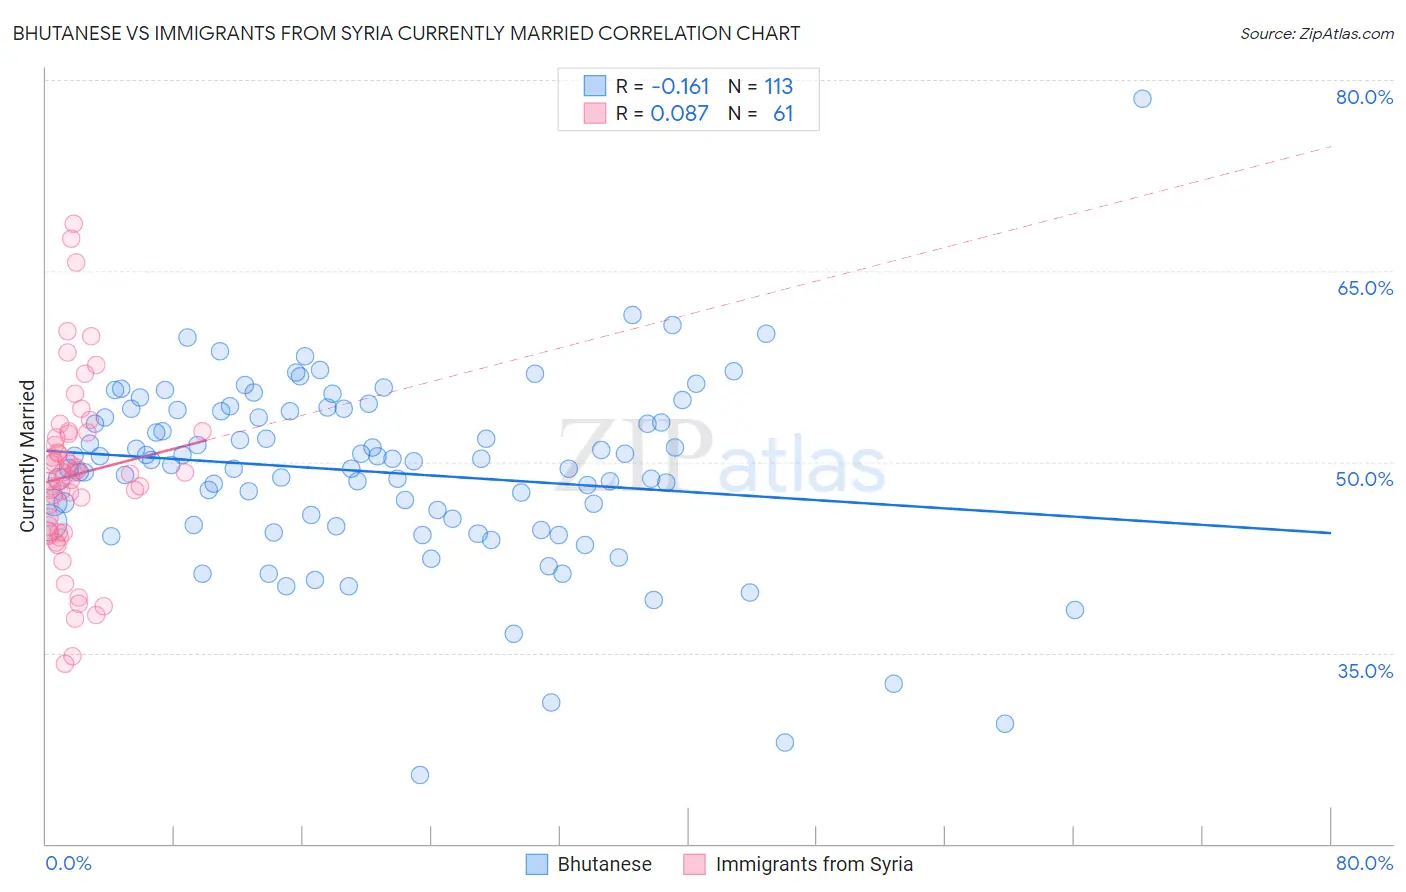
Bhutanese vs Immigrants from Syria Currently Married Correlation Chart
The statistical analysis conducted on geographies consisting of 455,493,629 people shows a poor negative correlation between the proportion of Bhutanese and percentage of population currently married in the United States with a correlation coefficient (R) of -0.161 and weighted average of 48.6%. Similarly, the statistical analysis conducted on geographies consisting of 174,114,575 people shows a slight positive correlation between the proportion of Immigrants from Syria and percentage of population currently married in the United States with a correlation coefficient (R) of 0.087 and weighted average of 46.8%, a difference of 3.9%.
Currently Married Correlation Summary
| Measurement | Bhutanese | Immigrants from Syria |
| Minimum | 25.4% | 34.1% |
| Maximum | 78.5% | 68.7% |
| Range | 53.1% | 34.6% |
| Mean | 49.2% | 49.0% |
| Median | 50.1% | 49.1% |
| Interquartile 25% (IQ1) | 45.2% | 44.5% |
| Interquartile 75% (IQ3) | 54.0% | 52.2% |
| Interquartile Range (IQR) | 8.9% | 7.8% |
| Standard Deviation (Sample) | 7.3% | 7.0% |
| Standard Deviation (Population) | 7.3% | 7.0% |
Similar Demographics by Currently Married
Demographics Similar to Bhutanese by Currently Married
In terms of currently married, the demographic groups most similar to Bhutanese are Iranian (48.6%, a difference of 0.060%), White/Caucasian (48.6%, a difference of 0.070%), Austrian (48.7%, a difference of 0.13%), Northern European (48.7%, a difference of 0.14%), and Immigrants from Iran (48.7%, a difference of 0.15%).
| Demographics | Rating | Rank | Currently Married |
| Finns | 99.3 /100 | #42 | Exceptional 48.8% |
| Scotch-Irish | 99.3 /100 | #43 | Exceptional 48.7% |
| Immigrants | North America | 99.3 /100 | #44 | Exceptional 48.7% |
| Belgians | 99.3 /100 | #45 | Exceptional 48.7% |
| Immigrants | Iran | 99.2 /100 | #46 | Exceptional 48.7% |
| Northern Europeans | 99.2 /100 | #47 | Exceptional 48.7% |
| Austrians | 99.2 /100 | #48 | Exceptional 48.7% |
| Bhutanese | 99.1 /100 | #49 | Exceptional 48.6% |
| Iranians | 99.0 /100 | #50 | Exceptional 48.6% |
| Whites/Caucasians | 99.0 /100 | #51 | Exceptional 48.6% |
| Russians | 98.9 /100 | #52 | Exceptional 48.6% |
| Immigrants | Austria | 98.8 /100 | #53 | Exceptional 48.5% |
| Immigrants | Moldova | 98.7 /100 | #54 | Exceptional 48.5% |
| Immigrants | North Macedonia | 98.7 /100 | #55 | Exceptional 48.5% |
| Latvians | 98.7 /100 | #56 | Exceptional 48.5% |
Demographics Similar to Immigrants from Syria by Currently Married
In terms of currently married, the demographic groups most similar to Immigrants from Syria are Samoan (46.8%, a difference of 0.020%), Spaniard (46.8%, a difference of 0.020%), Immigrants from Afghanistan (46.8%, a difference of 0.040%), Armenian (46.8%, a difference of 0.040%), and Immigrants from Latvia (46.7%, a difference of 0.10%).
| Demographics | Rating | Rank | Currently Married |
| Iraqis | 66.4 /100 | #159 | Good 46.9% |
| Immigrants | Uzbekistan | 66.0 /100 | #160 | Good 46.9% |
| Immigrants | Southern Europe | 65.9 /100 | #161 | Good 46.9% |
| Immigrants | Nonimmigrants | 65.4 /100 | #162 | Good 46.9% |
| Delaware | 64.7 /100 | #163 | Good 46.9% |
| Immigrants | Western Asia | 64.2 /100 | #164 | Good 46.9% |
| Samoans | 59.8 /100 | #165 | Average 46.8% |
| Immigrants | Syria | 59.3 /100 | #166 | Average 46.8% |
| Spaniards | 58.8 /100 | #167 | Average 46.8% |
| Immigrants | Afghanistan | 58.2 /100 | #168 | Average 46.8% |
| Armenians | 58.2 /100 | #169 | Average 46.8% |
| Immigrants | Latvia | 56.7 /100 | #170 | Average 46.7% |
| Immigrants | Zimbabwe | 52.4 /100 | #171 | Average 46.7% |
| Aleuts | 52.0 /100 | #172 | Average 46.7% |
| Tlingit-Haida | 51.2 /100 | #173 | Average 46.7% |