Immigrants from Argentina vs Immigrants from Syria Currently Married
COMPARE
Immigrants from Argentina
Immigrants from Syria
Currently Married
Currently Married Comparison
Immigrants from Argentina
Immigrants from Syria
47.0%
CURRENTLY MARRIED
72.0/ 100
METRIC RATING
147th/ 347
METRIC RANK
46.8%
CURRENTLY MARRIED
59.3/ 100
METRIC RATING
166th/ 347
METRIC RANK
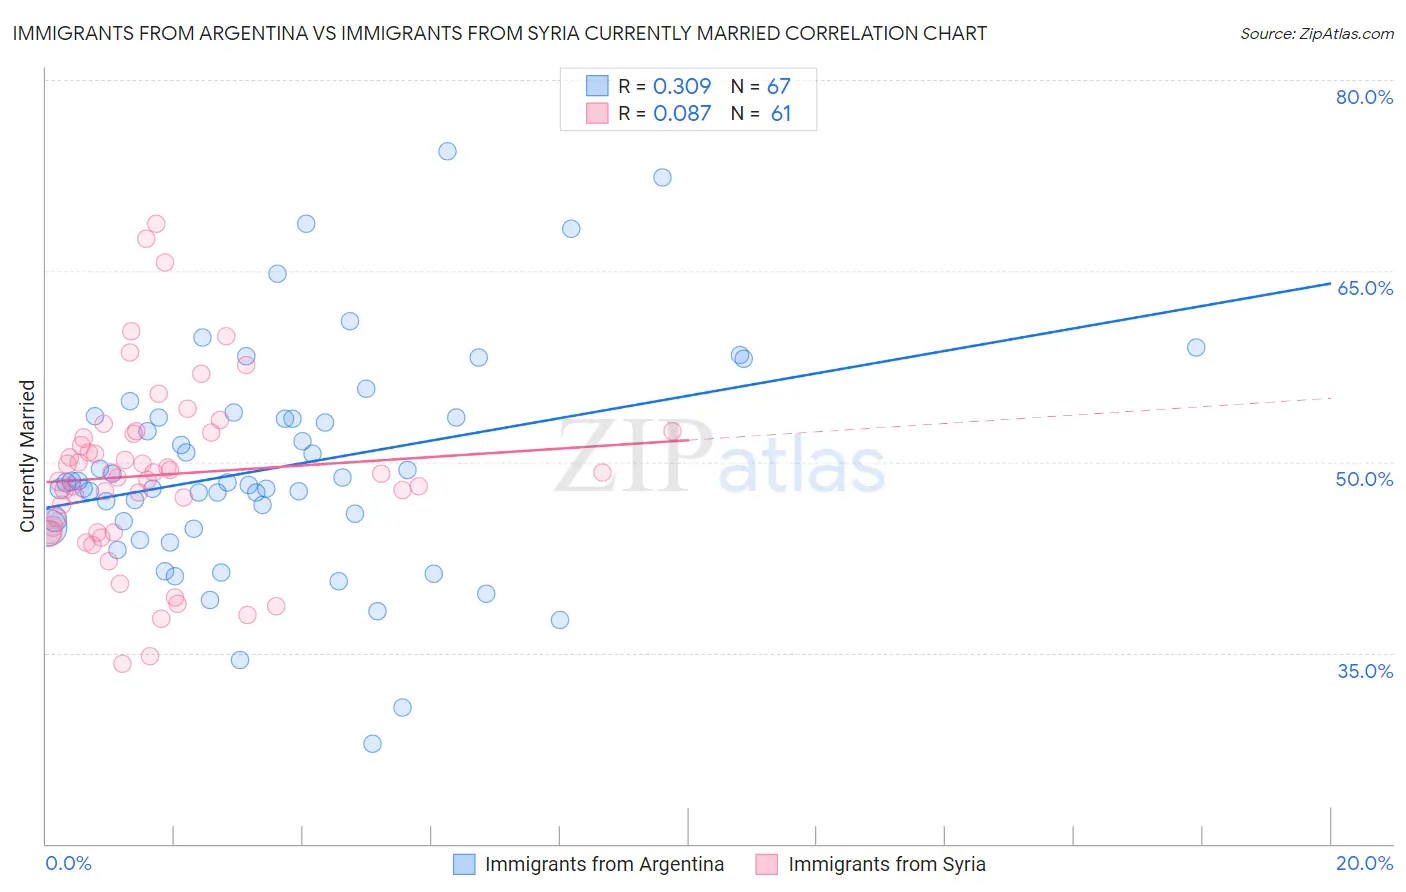
Immigrants from Argentina vs Immigrants from Syria Currently Married Correlation Chart
The statistical analysis conducted on geographies consisting of 264,414,041 people shows a mild positive correlation between the proportion of Immigrants from Argentina and percentage of population currently married in the United States with a correlation coefficient (R) of 0.309 and weighted average of 47.0%. Similarly, the statistical analysis conducted on geographies consisting of 174,114,575 people shows a slight positive correlation between the proportion of Immigrants from Syria and percentage of population currently married in the United States with a correlation coefficient (R) of 0.087 and weighted average of 46.8%, a difference of 0.52%.
Currently Married Correlation Summary
| Measurement | Immigrants from Argentina | Immigrants from Syria |
| Minimum | 27.9% | 34.1% |
| Maximum | 74.4% | 68.7% |
| Range | 46.5% | 34.6% |
| Mean | 49.6% | 49.0% |
| Median | 48.4% | 49.1% |
| Interquartile 25% (IQ1) | 44.8% | 44.5% |
| Interquartile 75% (IQ3) | 53.5% | 52.2% |
| Interquartile Range (IQR) | 8.7% | 7.8% |
| Standard Deviation (Sample) | 8.8% | 7.0% |
| Standard Deviation (Population) | 8.7% | 7.0% |
Demographics Similar to Immigrants from Argentina and Immigrants from Syria by Currently Married
In terms of currently married, the demographic groups most similar to Immigrants from Argentina are Carpatho Rusyn (47.0%, a difference of 0.030%), Cambodian (47.0%, a difference of 0.070%), Zimbabwean (47.0%, a difference of 0.090%), Immigrants from Turkey (47.0%, a difference of 0.090%), and Chilean (47.0%, a difference of 0.10%). Similarly, the demographic groups most similar to Immigrants from Syria are Samoan (46.8%, a difference of 0.020%), Immigrants from Western Asia (46.9%, a difference of 0.19%), Delaware (46.9%, a difference of 0.21%), Nonimmigrants (46.9%, a difference of 0.24%), and Immigrants from Uzbekistan (46.9%, a difference of 0.26%).
| Demographics | Rating | Rank | Currently Married |
| Carpatho Rusyns | 72.6 /100 | #146 | Good 47.0% |
| Immigrants | Argentina | 72.0 /100 | #147 | Good 47.0% |
| Cambodians | 70.4 /100 | #148 | Good 47.0% |
| Zimbabweans | 70.1 /100 | #149 | Good 47.0% |
| Immigrants | Turkey | 70.0 /100 | #150 | Good 47.0% |
| Chileans | 69.8 /100 | #151 | Good 47.0% |
| Immigrants | Serbia | 68.8 /100 | #152 | Good 47.0% |
| Immigrants | Venezuela | 68.6 /100 | #153 | Good 47.0% |
| Albanians | 68.6 /100 | #154 | Good 47.0% |
| Arabs | 68.6 /100 | #155 | Good 47.0% |
| Spanish | 68.1 /100 | #156 | Good 47.0% |
| Immigrants | Switzerland | 67.8 /100 | #157 | Good 46.9% |
| Cherokee | 66.8 /100 | #158 | Good 46.9% |
| Iraqis | 66.4 /100 | #159 | Good 46.9% |
| Immigrants | Uzbekistan | 66.0 /100 | #160 | Good 46.9% |
| Immigrants | Southern Europe | 65.9 /100 | #161 | Good 46.9% |
| Immigrants | Nonimmigrants | 65.4 /100 | #162 | Good 46.9% |
| Delaware | 64.7 /100 | #163 | Good 46.9% |
| Immigrants | Western Asia | 64.2 /100 | #164 | Good 46.9% |
| Samoans | 59.8 /100 | #165 | Average 46.8% |
| Immigrants | Syria | 59.3 /100 | #166 | Average 46.8% |