Bhutanese vs Yakama Currently Married
COMPARE
Bhutanese
Yakama
Currently Married
Currently Married Comparison
Bhutanese
Yakama
48.6%
CURRENTLY MARRIED
99.1/ 100
METRIC RATING
49th/ 347
METRIC RANK
44.0%
CURRENTLY MARRIED
0.2/ 100
METRIC RATING
255th/ 347
METRIC RANK
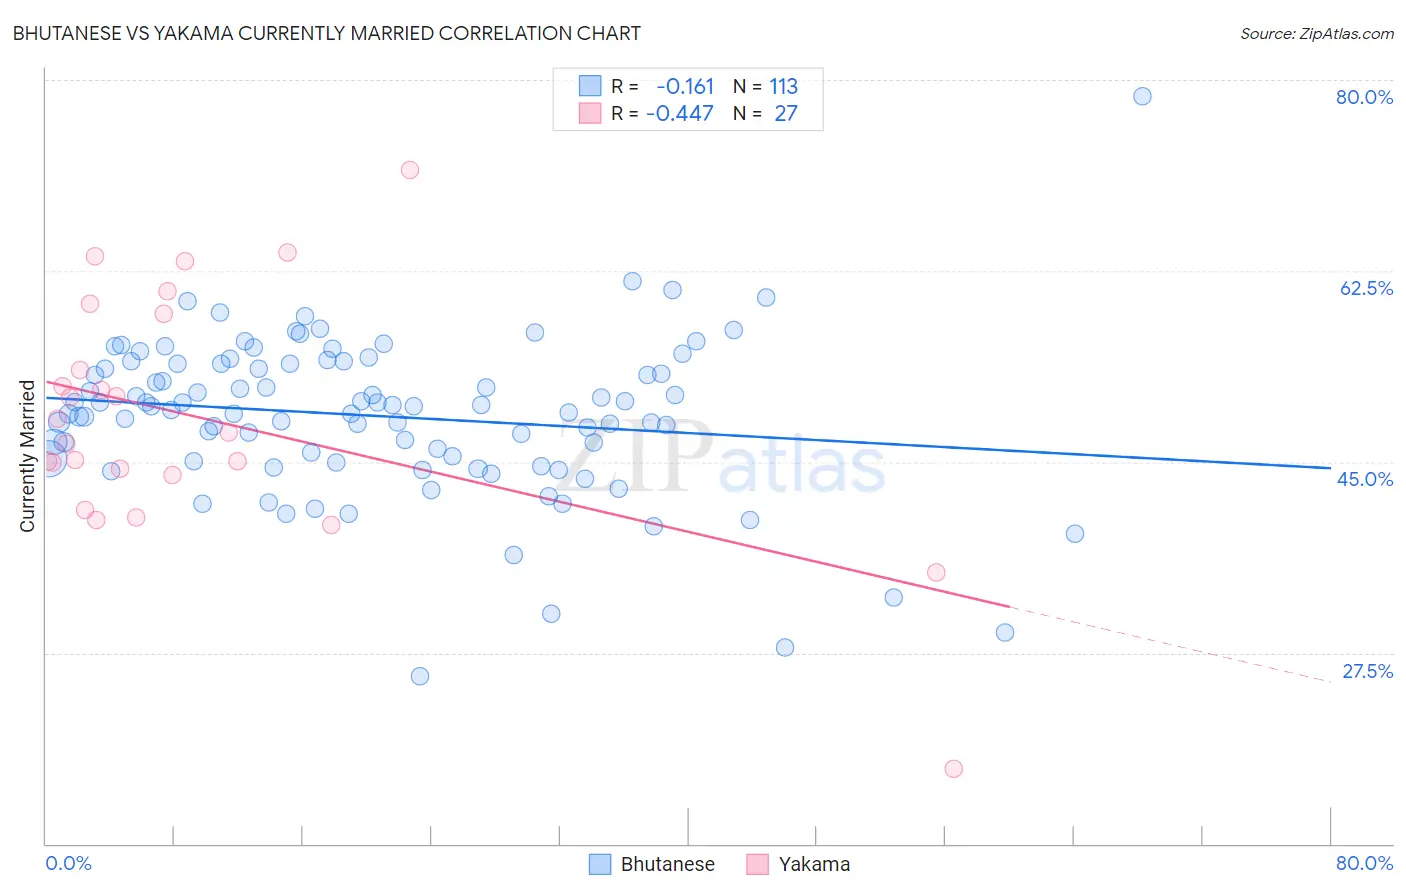
Bhutanese vs Yakama Currently Married Correlation Chart
The statistical analysis conducted on geographies consisting of 455,493,629 people shows a poor negative correlation between the proportion of Bhutanese and percentage of population currently married in the United States with a correlation coefficient (R) of -0.161 and weighted average of 48.6%. Similarly, the statistical analysis conducted on geographies consisting of 19,923,144 people shows a moderate negative correlation between the proportion of Yakama and percentage of population currently married in the United States with a correlation coefficient (R) of -0.447 and weighted average of 44.0%, a difference of 10.5%.
Currently Married Correlation Summary
| Measurement | Bhutanese | Yakama |
| Minimum | 25.4% | 16.9% |
| Maximum | 78.5% | 71.8% |
| Range | 53.1% | 54.9% |
| Mean | 49.2% | 49.0% |
| Median | 50.1% | 47.7% |
| Interquartile 25% (IQ1) | 45.2% | 43.8% |
| Interquartile 75% (IQ3) | 54.0% | 58.6% |
| Interquartile Range (IQR) | 8.9% | 14.8% |
| Standard Deviation (Sample) | 7.3% | 11.2% |
| Standard Deviation (Population) | 7.3% | 11.0% |
Similar Demographics by Currently Married
Demographics Similar to Bhutanese by Currently Married
In terms of currently married, the demographic groups most similar to Bhutanese are Iranian (48.6%, a difference of 0.060%), White/Caucasian (48.6%, a difference of 0.070%), Austrian (48.7%, a difference of 0.13%), Northern European (48.7%, a difference of 0.14%), and Immigrants from Iran (48.7%, a difference of 0.15%).
| Demographics | Rating | Rank | Currently Married |
| Finns | 99.3 /100 | #42 | Exceptional 48.8% |
| Scotch-Irish | 99.3 /100 | #43 | Exceptional 48.7% |
| Immigrants | North America | 99.3 /100 | #44 | Exceptional 48.7% |
| Belgians | 99.3 /100 | #45 | Exceptional 48.7% |
| Immigrants | Iran | 99.2 /100 | #46 | Exceptional 48.7% |
| Northern Europeans | 99.2 /100 | #47 | Exceptional 48.7% |
| Austrians | 99.2 /100 | #48 | Exceptional 48.7% |
| Bhutanese | 99.1 /100 | #49 | Exceptional 48.6% |
| Iranians | 99.0 /100 | #50 | Exceptional 48.6% |
| Whites/Caucasians | 99.0 /100 | #51 | Exceptional 48.6% |
| Russians | 98.9 /100 | #52 | Exceptional 48.6% |
| Immigrants | Austria | 98.8 /100 | #53 | Exceptional 48.5% |
| Immigrants | Moldova | 98.7 /100 | #54 | Exceptional 48.5% |
| Immigrants | North Macedonia | 98.7 /100 | #55 | Exceptional 48.5% |
| Latvians | 98.7 /100 | #56 | Exceptional 48.5% |
Demographics Similar to Yakama by Currently Married
In terms of currently married, the demographic groups most similar to Yakama are Shoshone (44.0%, a difference of 0.050%), Vietnamese (44.0%, a difference of 0.070%), Immigrants from Africa (43.9%, a difference of 0.25%), Ute (43.9%, a difference of 0.26%), and Immigrants from Central America (44.1%, a difference of 0.32%).
| Demographics | Rating | Rank | Currently Married |
| Nicaraguans | 0.3 /100 | #248 | Tragic 44.2% |
| Immigrants | Cameroon | 0.3 /100 | #249 | Tragic 44.2% |
| Immigrants | Eastern Africa | 0.3 /100 | #250 | Tragic 44.2% |
| Blackfeet | 0.3 /100 | #251 | Tragic 44.2% |
| Hispanics or Latinos | 0.3 /100 | #252 | Tragic 44.1% |
| Immigrants | Central America | 0.3 /100 | #253 | Tragic 44.1% |
| Vietnamese | 0.2 /100 | #254 | Tragic 44.0% |
| Yakama | 0.2 /100 | #255 | Tragic 44.0% |
| Shoshone | 0.2 /100 | #256 | Tragic 44.0% |
| Immigrants | Africa | 0.2 /100 | #257 | Tragic 43.9% |
| Ute | 0.2 /100 | #258 | Tragic 43.9% |
| Immigrants | Sierra Leone | 0.1 /100 | #259 | Tragic 43.8% |
| Immigrants | Latin America | 0.1 /100 | #260 | Tragic 43.8% |
| Immigrants | Nicaragua | 0.1 /100 | #261 | Tragic 43.7% |
| Bangladeshis | 0.1 /100 | #262 | Tragic 43.7% |