Venezuelan vs Immigrants from Syria Currently Married
COMPARE
Venezuelan
Immigrants from Syria
Currently Married
Currently Married Comparison
Venezuelans
Immigrants from Syria
47.1%
CURRENTLY MARRIED
74.4/ 100
METRIC RATING
141st/ 347
METRIC RANK
46.8%
CURRENTLY MARRIED
59.3/ 100
METRIC RATING
166th/ 347
METRIC RANK
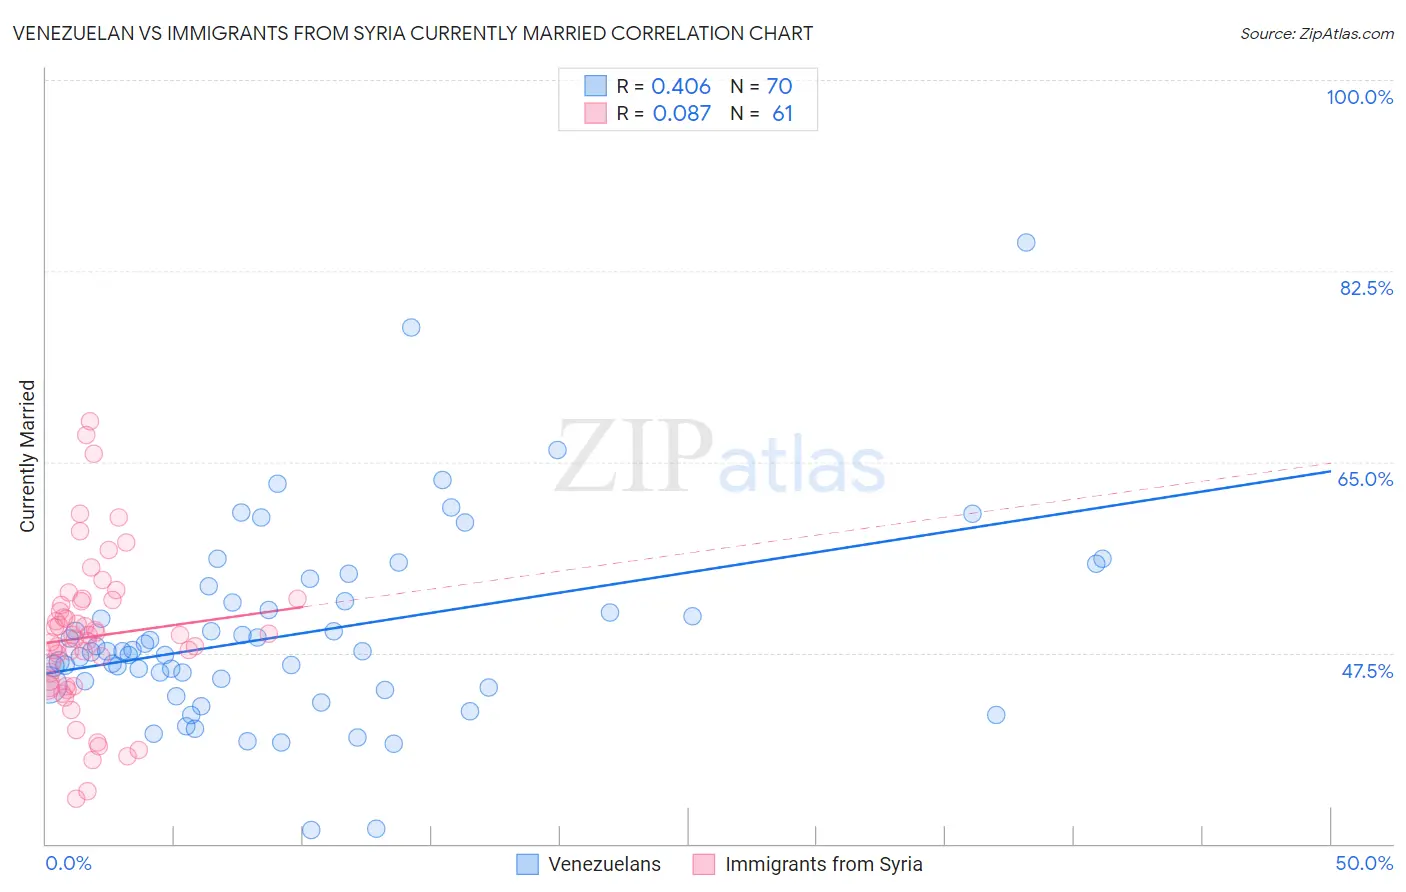
Venezuelan vs Immigrants from Syria Currently Married Correlation Chart
The statistical analysis conducted on geographies consisting of 306,286,005 people shows a moderate positive correlation between the proportion of Venezuelans and percentage of population currently married in the United States with a correlation coefficient (R) of 0.406 and weighted average of 47.1%. Similarly, the statistical analysis conducted on geographies consisting of 174,114,575 people shows a slight positive correlation between the proportion of Immigrants from Syria and percentage of population currently married in the United States with a correlation coefficient (R) of 0.087 and weighted average of 46.8%, a difference of 0.63%.
Currently Married Correlation Summary
| Measurement | Venezuelan | Immigrants from Syria |
| Minimum | 31.2% | 34.1% |
| Maximum | 85.1% | 68.7% |
| Range | 53.9% | 34.6% |
| Mean | 49.3% | 49.0% |
| Median | 47.6% | 49.1% |
| Interquartile 25% (IQ1) | 44.5% | 44.5% |
| Interquartile 75% (IQ3) | 52.2% | 52.2% |
| Interquartile Range (IQR) | 7.7% | 7.8% |
| Standard Deviation (Sample) | 8.8% | 7.0% |
| Standard Deviation (Population) | 8.8% | 7.0% |
Similar Demographics by Currently Married
Demographics Similar to Venezuelans by Currently Married
In terms of currently married, the demographic groups most similar to Venezuelans are Argentinean (47.1%, a difference of 0.0%), Guamanian/Chamorro (47.1%, a difference of 0.010%), Cajun (47.1%, a difference of 0.040%), Hmong (47.1%, a difference of 0.050%), and Immigrants from South Eastern Asia (47.1%, a difference of 0.070%).
| Demographics | Rating | Rank | Currently Married |
| Immigrants | Australia | 81.1 /100 | #134 | Excellent 47.3% |
| Immigrants | Norway | 79.7 /100 | #135 | Good 47.2% |
| Immigrants | Vietnam | 78.2 /100 | #136 | Good 47.2% |
| Paraguayans | 77.8 /100 | #137 | Good 47.2% |
| Pakistanis | 77.5 /100 | #138 | Good 47.2% |
| Yugoslavians | 77.4 /100 | #139 | Good 47.2% |
| Cajuns | 75.3 /100 | #140 | Good 47.1% |
| Venezuelans | 74.4 /100 | #141 | Good 47.1% |
| Argentineans | 74.4 /100 | #142 | Good 47.1% |
| Guamanians/Chamorros | 74.2 /100 | #143 | Good 47.1% |
| Hmong | 73.4 /100 | #144 | Good 47.1% |
| Immigrants | South Eastern Asia | 72.9 /100 | #145 | Good 47.1% |
| Carpatho Rusyns | 72.6 /100 | #146 | Good 47.0% |
| Immigrants | Argentina | 72.0 /100 | #147 | Good 47.0% |
| Cambodians | 70.4 /100 | #148 | Good 47.0% |
Demographics Similar to Immigrants from Syria by Currently Married
In terms of currently married, the demographic groups most similar to Immigrants from Syria are Samoan (46.8%, a difference of 0.020%), Spaniard (46.8%, a difference of 0.020%), Immigrants from Afghanistan (46.8%, a difference of 0.040%), Armenian (46.8%, a difference of 0.040%), and Immigrants from Latvia (46.7%, a difference of 0.10%).
| Demographics | Rating | Rank | Currently Married |
| Iraqis | 66.4 /100 | #159 | Good 46.9% |
| Immigrants | Uzbekistan | 66.0 /100 | #160 | Good 46.9% |
| Immigrants | Southern Europe | 65.9 /100 | #161 | Good 46.9% |
| Immigrants | Nonimmigrants | 65.4 /100 | #162 | Good 46.9% |
| Delaware | 64.7 /100 | #163 | Good 46.9% |
| Immigrants | Western Asia | 64.2 /100 | #164 | Good 46.9% |
| Samoans | 59.8 /100 | #165 | Average 46.8% |
| Immigrants | Syria | 59.3 /100 | #166 | Average 46.8% |
| Spaniards | 58.8 /100 | #167 | Average 46.8% |
| Immigrants | Afghanistan | 58.2 /100 | #168 | Average 46.8% |
| Armenians | 58.2 /100 | #169 | Average 46.8% |
| Immigrants | Latvia | 56.7 /100 | #170 | Average 46.7% |
| Immigrants | Zimbabwe | 52.4 /100 | #171 | Average 46.7% |
| Aleuts | 52.0 /100 | #172 | Average 46.7% |
| Tlingit-Haida | 51.2 /100 | #173 | Average 46.7% |