Bhutanese vs Palestinian Currently Married
COMPARE
Bhutanese
Palestinian
Currently Married
Currently Married Comparison
Bhutanese
Palestinians
48.6%
CURRENTLY MARRIED
99.1/ 100
METRIC RATING
49th/ 347
METRIC RANK
47.6%
CURRENTLY MARRIED
90.4/ 100
METRIC RATING
116th/ 347
METRIC RANK
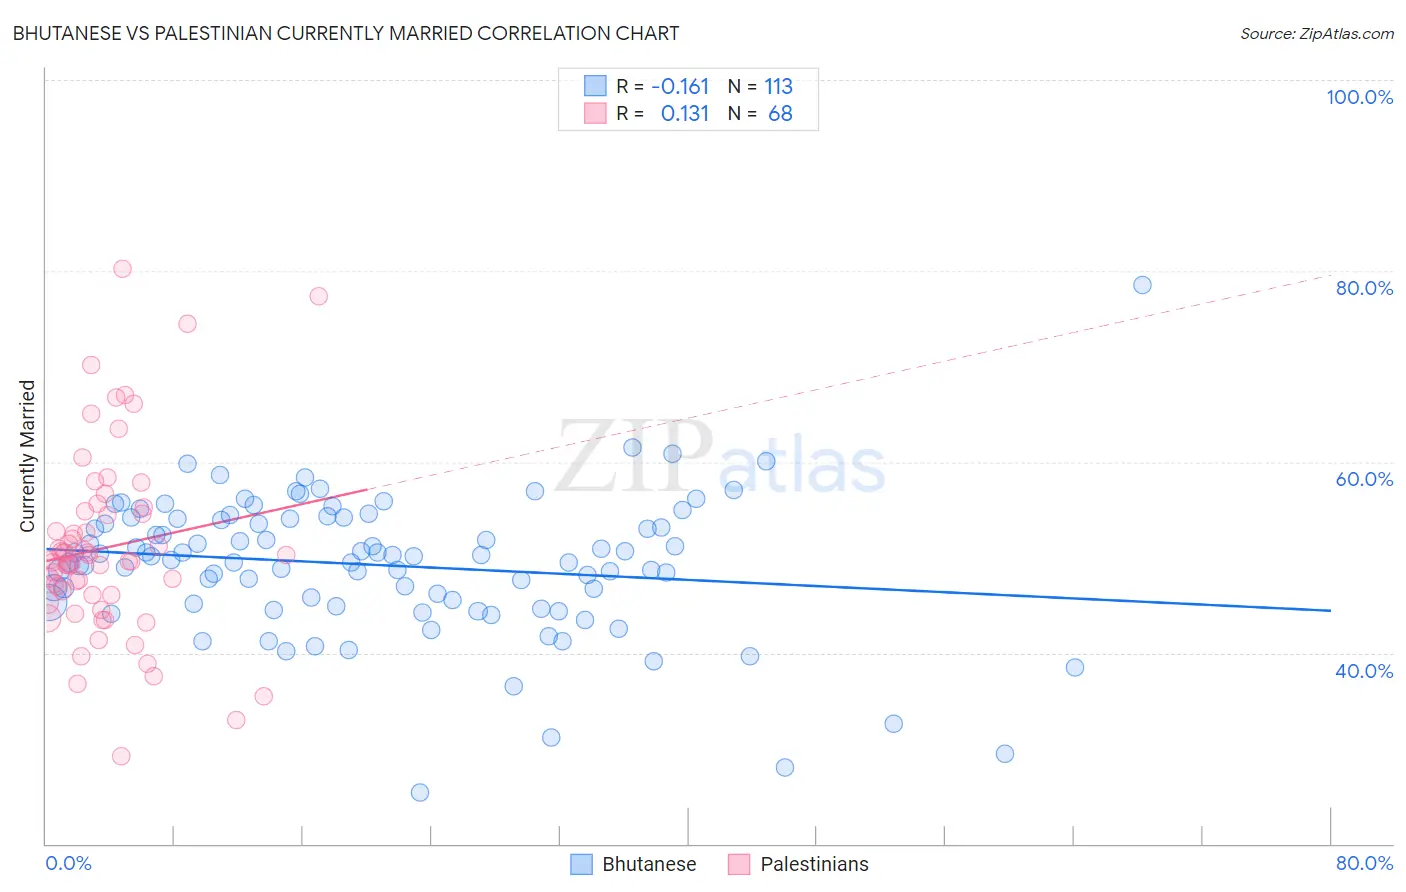
Bhutanese vs Palestinian Currently Married Correlation Chart
The statistical analysis conducted on geographies consisting of 455,493,629 people shows a poor negative correlation between the proportion of Bhutanese and percentage of population currently married in the United States with a correlation coefficient (R) of -0.161 and weighted average of 48.6%. Similarly, the statistical analysis conducted on geographies consisting of 216,437,079 people shows a poor positive correlation between the proportion of Palestinians and percentage of population currently married in the United States with a correlation coefficient (R) of 0.131 and weighted average of 47.6%, a difference of 2.2%.
Currently Married Correlation Summary
| Measurement | Bhutanese | Palestinian |
| Minimum | 25.4% | 29.1% |
| Maximum | 78.5% | 80.2% |
| Range | 53.1% | 51.1% |
| Mean | 49.2% | 51.0% |
| Median | 50.1% | 49.7% |
| Interquartile 25% (IQ1) | 45.2% | 46.0% |
| Interquartile 75% (IQ3) | 54.0% | 54.7% |
| Interquartile Range (IQR) | 8.9% | 8.7% |
| Standard Deviation (Sample) | 7.3% | 9.7% |
| Standard Deviation (Population) | 7.3% | 9.7% |
Similar Demographics by Currently Married
Demographics Similar to Bhutanese by Currently Married
In terms of currently married, the demographic groups most similar to Bhutanese are Iranian (48.6%, a difference of 0.060%), White/Caucasian (48.6%, a difference of 0.070%), Austrian (48.7%, a difference of 0.13%), Northern European (48.7%, a difference of 0.14%), and Immigrants from Iran (48.7%, a difference of 0.15%).
| Demographics | Rating | Rank | Currently Married |
| Finns | 99.3 /100 | #42 | Exceptional 48.8% |
| Scotch-Irish | 99.3 /100 | #43 | Exceptional 48.7% |
| Immigrants | North America | 99.3 /100 | #44 | Exceptional 48.7% |
| Belgians | 99.3 /100 | #45 | Exceptional 48.7% |
| Immigrants | Iran | 99.2 /100 | #46 | Exceptional 48.7% |
| Northern Europeans | 99.2 /100 | #47 | Exceptional 48.7% |
| Austrians | 99.2 /100 | #48 | Exceptional 48.7% |
| Bhutanese | 99.1 /100 | #49 | Exceptional 48.6% |
| Iranians | 99.0 /100 | #50 | Exceptional 48.6% |
| Whites/Caucasians | 99.0 /100 | #51 | Exceptional 48.6% |
| Russians | 98.9 /100 | #52 | Exceptional 48.6% |
| Immigrants | Austria | 98.8 /100 | #53 | Exceptional 48.5% |
| Immigrants | Moldova | 98.7 /100 | #54 | Exceptional 48.5% |
| Immigrants | North Macedonia | 98.7 /100 | #55 | Exceptional 48.5% |
| Latvians | 98.7 /100 | #56 | Exceptional 48.5% |
Demographics Similar to Palestinians by Currently Married
In terms of currently married, the demographic groups most similar to Palestinians are South African (47.6%, a difference of 0.010%), Immigrants from Indonesia (47.6%, a difference of 0.010%), Puget Sound Salish (47.6%, a difference of 0.020%), Immigrants from Philippines (47.6%, a difference of 0.020%), and Australian (47.6%, a difference of 0.020%).
| Demographics | Rating | Rank | Currently Married |
| Immigrants | Egypt | 92.3 /100 | #109 | Exceptional 47.7% |
| Immigrants | Russia | 92.0 /100 | #110 | Exceptional 47.7% |
| Immigrants | Hungary | 91.2 /100 | #111 | Exceptional 47.6% |
| Immigrants | Western Europe | 91.1 /100 | #112 | Exceptional 47.6% |
| Immigrants | Denmark | 90.9 /100 | #113 | Exceptional 47.6% |
| South Africans | 90.5 /100 | #114 | Exceptional 47.6% |
| Immigrants | Indonesia | 90.5 /100 | #115 | Exceptional 47.6% |
| Palestinians | 90.4 /100 | #116 | Exceptional 47.6% |
| Puget Sound Salish | 90.3 /100 | #117 | Exceptional 47.6% |
| Immigrants | Philippines | 90.2 /100 | #118 | Exceptional 47.6% |
| Australians | 90.2 /100 | #119 | Exceptional 47.6% |
| Syrians | 88.9 /100 | #120 | Excellent 47.5% |
| Immigrants | Croatia | 88.6 /100 | #121 | Excellent 47.5% |
| Osage | 87.9 /100 | #122 | Excellent 47.5% |
| Immigrants | Kazakhstan | 87.2 /100 | #123 | Excellent 47.4% |