Bhutanese vs Immigrants from Czechoslovakia Currently Married
COMPARE
Bhutanese
Immigrants from Czechoslovakia
Currently Married
Currently Married Comparison
Bhutanese
Immigrants from Czechoslovakia
48.6%
CURRENTLY MARRIED
99.1/ 100
METRIC RATING
49th/ 347
METRIC RANK
48.4%
CURRENTLY MARRIED
98.3/ 100
METRIC RATING
64th/ 347
METRIC RANK
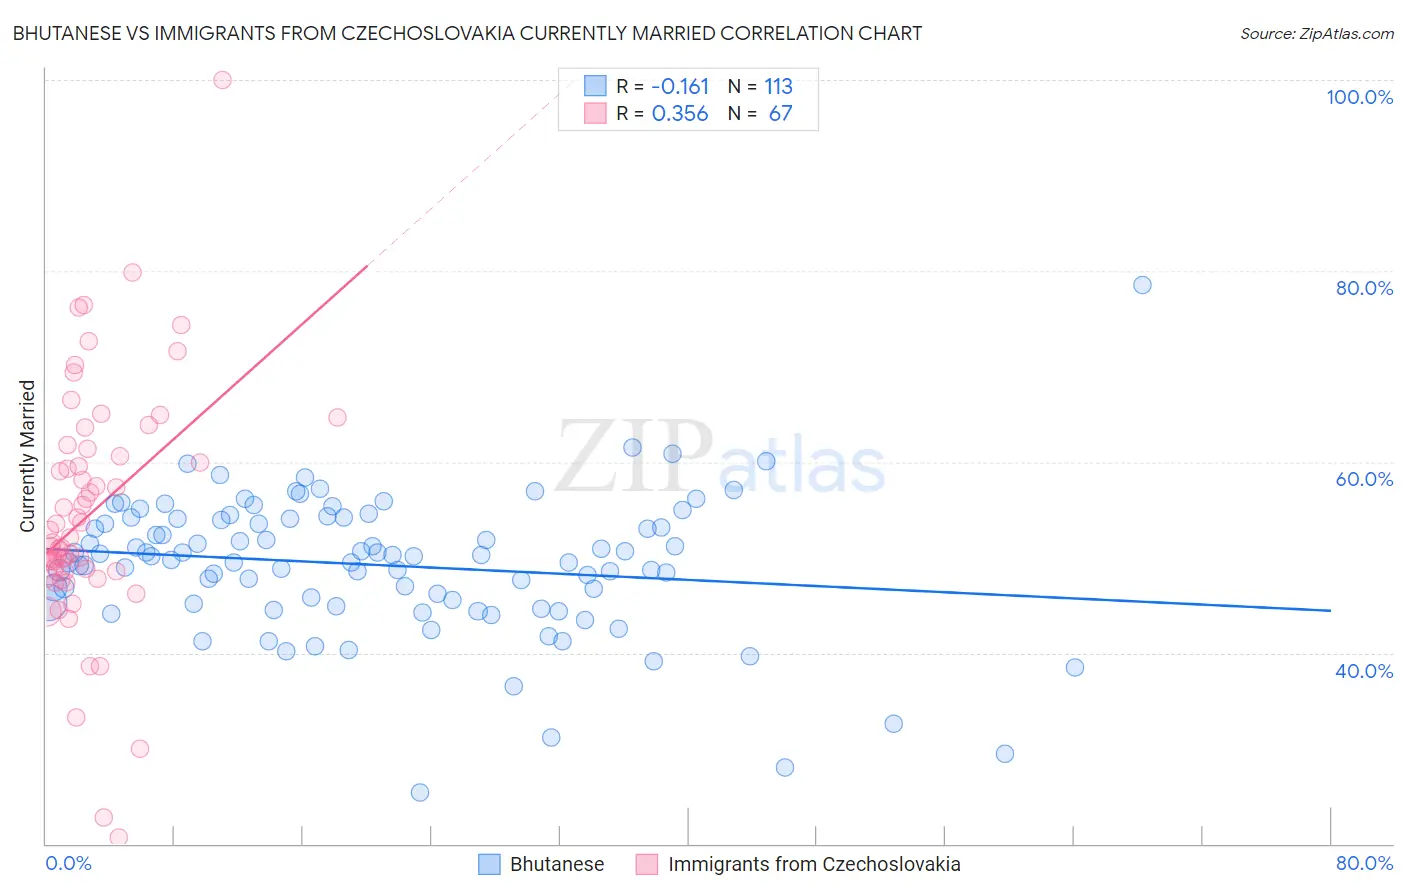
Bhutanese vs Immigrants from Czechoslovakia Currently Married Correlation Chart
The statistical analysis conducted on geographies consisting of 455,493,629 people shows a poor negative correlation between the proportion of Bhutanese and percentage of population currently married in the United States with a correlation coefficient (R) of -0.161 and weighted average of 48.6%. Similarly, the statistical analysis conducted on geographies consisting of 195,455,997 people shows a mild positive correlation between the proportion of Immigrants from Czechoslovakia and percentage of population currently married in the United States with a correlation coefficient (R) of 0.356 and weighted average of 48.4%, a difference of 0.58%.
Currently Married Correlation Summary
| Measurement | Bhutanese | Immigrants from Czechoslovakia |
| Minimum | 25.4% | 20.6% |
| Maximum | 78.5% | 100.0% |
| Range | 53.1% | 79.4% |
| Mean | 49.2% | 54.6% |
| Median | 50.1% | 52.0% |
| Interquartile 25% (IQ1) | 45.2% | 48.5% |
| Interquartile 75% (IQ3) | 54.0% | 61.4% |
| Interquartile Range (IQR) | 8.9% | 12.9% |
| Standard Deviation (Sample) | 7.3% | 12.8% |
| Standard Deviation (Population) | 7.3% | 12.7% |
Demographics Similar to Bhutanese and Immigrants from Czechoslovakia by Currently Married
In terms of currently married, the demographic groups most similar to Bhutanese are Iranian (48.6%, a difference of 0.060%), White/Caucasian (48.6%, a difference of 0.070%), Austrian (48.7%, a difference of 0.13%), Northern European (48.7%, a difference of 0.14%), and Immigrants from Iran (48.7%, a difference of 0.15%). Similarly, the demographic groups most similar to Immigrants from Czechoslovakia are Slavic (48.4%, a difference of 0.0%), Ukrainian (48.4%, a difference of 0.010%), Tongan (48.3%, a difference of 0.030%), Romanian (48.4%, a difference of 0.11%), and Asian (48.4%, a difference of 0.11%).
| Demographics | Rating | Rank | Currently Married |
| Immigrants | Iran | 99.2 /100 | #46 | Exceptional 48.7% |
| Northern Europeans | 99.2 /100 | #47 | Exceptional 48.7% |
| Austrians | 99.2 /100 | #48 | Exceptional 48.7% |
| Bhutanese | 99.1 /100 | #49 | Exceptional 48.6% |
| Iranians | 99.0 /100 | #50 | Exceptional 48.6% |
| Whites/Caucasians | 99.0 /100 | #51 | Exceptional 48.6% |
| Russians | 98.9 /100 | #52 | Exceptional 48.6% |
| Immigrants | Austria | 98.8 /100 | #53 | Exceptional 48.5% |
| Immigrants | Moldova | 98.7 /100 | #54 | Exceptional 48.5% |
| Immigrants | North Macedonia | 98.7 /100 | #55 | Exceptional 48.5% |
| Latvians | 98.7 /100 | #56 | Exceptional 48.5% |
| Immigrants | Netherlands | 98.6 /100 | #57 | Exceptional 48.5% |
| French | 98.6 /100 | #58 | Exceptional 48.4% |
| Immigrants | Ireland | 98.5 /100 | #59 | Exceptional 48.4% |
| Immigrants | Romania | 98.5 /100 | #60 | Exceptional 48.4% |
| Romanians | 98.5 /100 | #61 | Exceptional 48.4% |
| Asians | 98.5 /100 | #62 | Exceptional 48.4% |
| Slavs | 98.3 /100 | #63 | Exceptional 48.4% |
| Immigrants | Czechoslovakia | 98.3 /100 | #64 | Exceptional 48.4% |
| Ukrainians | 98.3 /100 | #65 | Exceptional 48.4% |
| Tongans | 98.2 /100 | #66 | Exceptional 48.3% |