Bhutanese vs Immigrants Currently Married
COMPARE
Bhutanese
Immigrants
Currently Married
Currently Married Comparison
Bhutanese
Immigrants
48.6%
CURRENTLY MARRIED
99.1/ 100
METRIC RATING
49th/ 347
METRIC RANK
45.8%
CURRENTLY MARRIED
11.2/ 100
METRIC RATING
206th/ 347
METRIC RANK
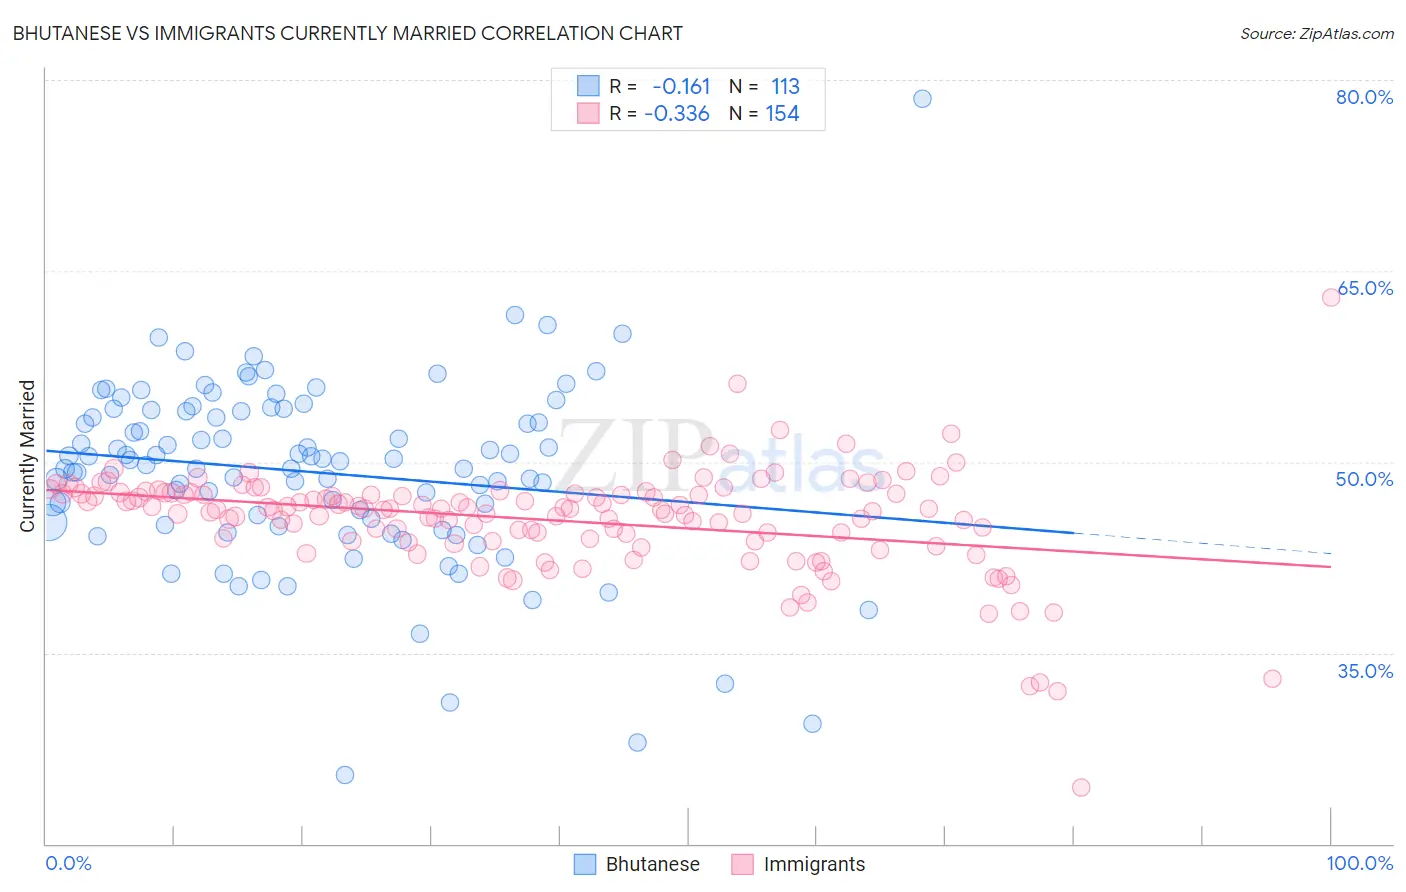
Bhutanese vs Immigrants Currently Married Correlation Chart
The statistical analysis conducted on geographies consisting of 455,493,629 people shows a poor negative correlation between the proportion of Bhutanese and percentage of population currently married in the United States with a correlation coefficient (R) of -0.161 and weighted average of 48.6%. Similarly, the statistical analysis conducted on geographies consisting of 577,640,121 people shows a mild negative correlation between the proportion of Immigrants and percentage of population currently married in the United States with a correlation coefficient (R) of -0.336 and weighted average of 45.8%, a difference of 6.3%.
Currently Married Correlation Summary
| Measurement | Bhutanese | Immigrants |
| Minimum | 25.4% | 24.5% |
| Maximum | 78.5% | 62.9% |
| Range | 53.1% | 38.5% |
| Mean | 49.2% | 45.4% |
| Median | 50.1% | 46.3% |
| Interquartile 25% (IQ1) | 45.2% | 43.8% |
| Interquartile 75% (IQ3) | 54.0% | 47.5% |
| Interquartile Range (IQR) | 8.9% | 3.7% |
| Standard Deviation (Sample) | 7.3% | 4.2% |
| Standard Deviation (Population) | 7.3% | 4.2% |
Similar Demographics by Currently Married
Demographics Similar to Bhutanese by Currently Married
In terms of currently married, the demographic groups most similar to Bhutanese are Iranian (48.6%, a difference of 0.060%), White/Caucasian (48.6%, a difference of 0.070%), Austrian (48.7%, a difference of 0.13%), Northern European (48.7%, a difference of 0.14%), and Immigrants from Iran (48.7%, a difference of 0.15%).
| Demographics | Rating | Rank | Currently Married |
| Finns | 99.3 /100 | #42 | Exceptional 48.8% |
| Scotch-Irish | 99.3 /100 | #43 | Exceptional 48.7% |
| Immigrants | North America | 99.3 /100 | #44 | Exceptional 48.7% |
| Belgians | 99.3 /100 | #45 | Exceptional 48.7% |
| Immigrants | Iran | 99.2 /100 | #46 | Exceptional 48.7% |
| Northern Europeans | 99.2 /100 | #47 | Exceptional 48.7% |
| Austrians | 99.2 /100 | #48 | Exceptional 48.7% |
| Bhutanese | 99.1 /100 | #49 | Exceptional 48.6% |
| Iranians | 99.0 /100 | #50 | Exceptional 48.6% |
| Whites/Caucasians | 99.0 /100 | #51 | Exceptional 48.6% |
| Russians | 98.9 /100 | #52 | Exceptional 48.6% |
| Immigrants | Austria | 98.8 /100 | #53 | Exceptional 48.5% |
| Immigrants | Moldova | 98.7 /100 | #54 | Exceptional 48.5% |
| Immigrants | North Macedonia | 98.7 /100 | #55 | Exceptional 48.5% |
| Latvians | 98.7 /100 | #56 | Exceptional 48.5% |
Demographics Similar to Immigrants by Currently Married
In terms of currently married, the demographic groups most similar to Immigrants are South American Indian (45.8%, a difference of 0.020%), Taiwanese (45.8%, a difference of 0.040%), Immigrants from Spain (45.8%, a difference of 0.040%), Immigrants from South America (45.7%, a difference of 0.040%), and Alsatian (45.7%, a difference of 0.050%).
| Demographics | Rating | Rank | Currently Married |
| Immigrants | Costa Rica | 19.6 /100 | #199 | Poor 46.0% |
| Creek | 17.2 /100 | #200 | Poor 46.0% |
| Malaysians | 15.3 /100 | #201 | Poor 45.9% |
| Immigrants | Albania | 14.5 /100 | #202 | Poor 45.9% |
| Taiwanese | 11.7 /100 | #203 | Poor 45.8% |
| Immigrants | Spain | 11.6 /100 | #204 | Poor 45.8% |
| South American Indians | 11.5 /100 | #205 | Poor 45.8% |
| Immigrants | Immigrants | 11.2 /100 | #206 | Poor 45.8% |
| Immigrants | South America | 10.8 /100 | #207 | Poor 45.7% |
| Alsatians | 10.8 /100 | #208 | Poor 45.7% |
| Immigrants | Micronesia | 8.8 /100 | #209 | Tragic 45.6% |
| Uruguayans | 7.9 /100 | #210 | Tragic 45.6% |
| Houma | 7.2 /100 | #211 | Tragic 45.5% |
| Marshallese | 7.2 /100 | #212 | Tragic 45.5% |
| Alaska Natives | 7.0 /100 | #213 | Tragic 45.5% |