Bhutanese vs Immigrants from Syria Family Poverty
COMPARE
Bhutanese
Immigrants from Syria
Family Poverty
Family Poverty Comparison
Bhutanese
Immigrants from Syria
7.0%
FAMILY POVERTY
99.9/ 100
METRIC RATING
8th/ 347
METRIC RANK
9.0%
FAMILY POVERTY
47.5/ 100
METRIC RATING
176th/ 347
METRIC RANK
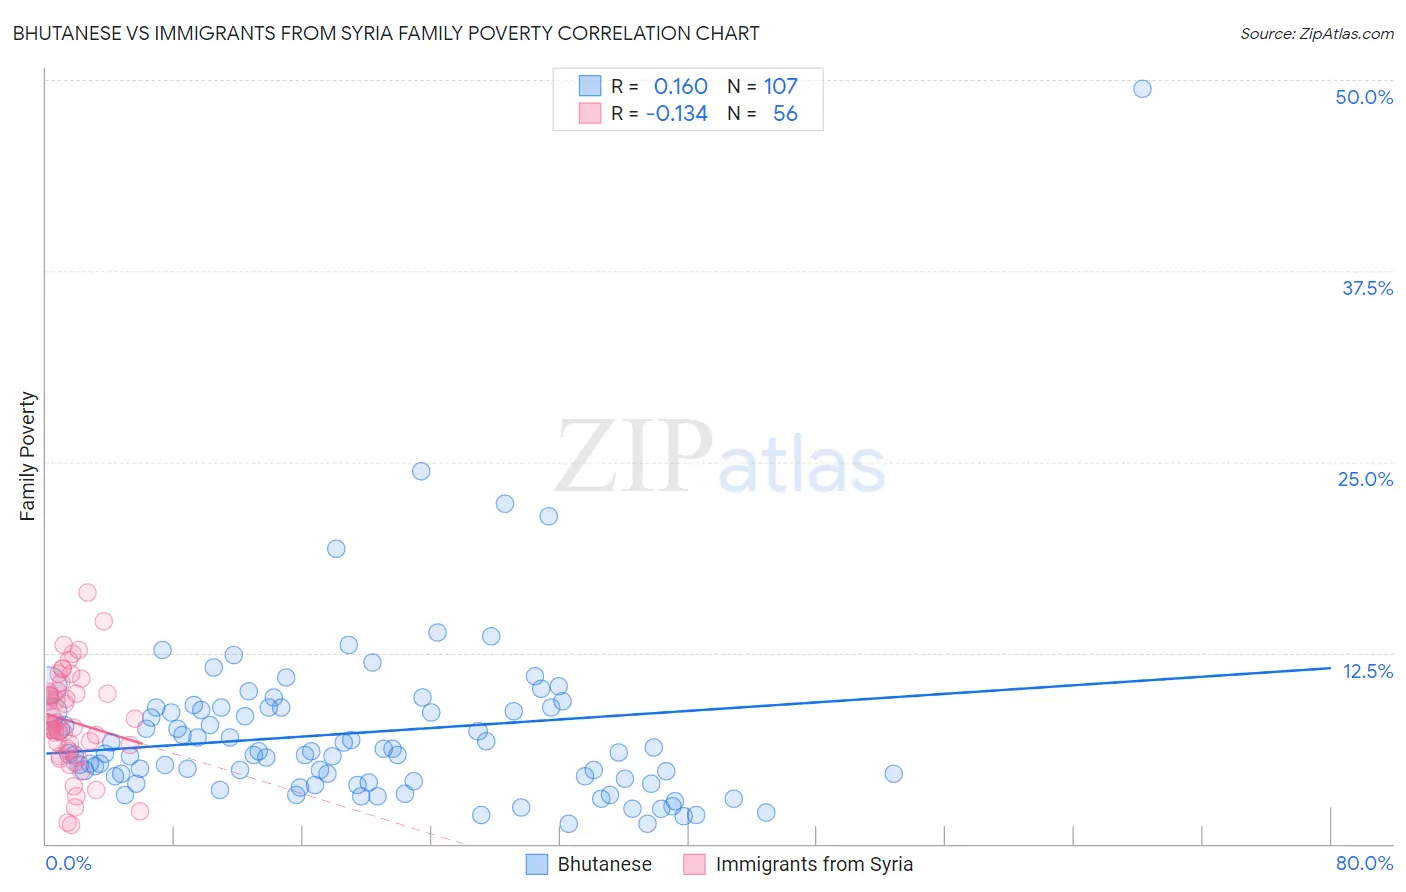
Bhutanese vs Immigrants from Syria Family Poverty Correlation Chart
The statistical analysis conducted on geographies consisting of 453,917,990 people shows a poor positive correlation between the proportion of Bhutanese and poverty level among families in the United States with a correlation coefficient (R) of 0.160 and weighted average of 7.0%. Similarly, the statistical analysis conducted on geographies consisting of 173,889,011 people shows a poor negative correlation between the proportion of Immigrants from Syria and poverty level among families in the United States with a correlation coefficient (R) of -0.134 and weighted average of 9.0%, a difference of 28.2%.
Family Poverty Correlation Summary
| Measurement | Bhutanese | Immigrants from Syria |
| Minimum | 1.3% | 1.2% |
| Maximum | 49.5% | 16.4% |
| Range | 48.2% | 15.2% |
| Mean | 7.3% | 8.0% |
| Median | 5.9% | 7.7% |
| Interquartile 25% (IQ1) | 4.1% | 6.2% |
| Interquartile 75% (IQ3) | 8.9% | 9.8% |
| Interquartile Range (IQR) | 4.9% | 3.7% |
| Standard Deviation (Sample) | 5.9% | 3.2% |
| Standard Deviation (Population) | 5.8% | 3.2% |
Similar Demographics by Family Poverty
Demographics Similar to Bhutanese by Family Poverty
In terms of family poverty, the demographic groups most similar to Bhutanese are Latvian (7.1%, a difference of 0.44%), Bulgarian (7.1%, a difference of 0.70%), Immigrants from Singapore (7.1%, a difference of 0.71%), Immigrants from Ireland (7.0%, a difference of 0.91%), and Maltese (7.1%, a difference of 1.0%).
| Demographics | Rating | Rank | Family Poverty |
| Immigrants | India | 100.0 /100 | #1 | Exceptional 6.2% |
| Chinese | 100.0 /100 | #2 | Exceptional 6.5% |
| Immigrants | Taiwan | 100.0 /100 | #3 | Exceptional 6.6% |
| Filipinos | 100.0 /100 | #4 | Exceptional 6.6% |
| Thais | 100.0 /100 | #5 | Exceptional 6.7% |
| Norwegians | 99.9 /100 | #6 | Exceptional 6.9% |
| Immigrants | Ireland | 99.9 /100 | #7 | Exceptional 7.0% |
| Bhutanese | 99.9 /100 | #8 | Exceptional 7.0% |
| Latvians | 99.9 /100 | #9 | Exceptional 7.1% |
| Bulgarians | 99.8 /100 | #10 | Exceptional 7.1% |
| Immigrants | Singapore | 99.8 /100 | #11 | Exceptional 7.1% |
| Maltese | 99.8 /100 | #12 | Exceptional 7.1% |
| Swedes | 99.8 /100 | #13 | Exceptional 7.1% |
| Iranians | 99.8 /100 | #14 | Exceptional 7.1% |
| Lithuanians | 99.8 /100 | #15 | Exceptional 7.2% |
Demographics Similar to Immigrants from Syria by Family Poverty
In terms of family poverty, the demographic groups most similar to Immigrants from Syria are Hawaiian (9.0%, a difference of 0.030%), Immigrants from Cameroon (9.0%, a difference of 0.040%), Costa Rican (9.0%, a difference of 0.24%), Immigrants from Albania (9.0%, a difference of 0.33%), and Immigrants from Iraq (9.1%, a difference of 0.41%).
| Demographics | Rating | Rank | Family Poverty |
| Immigrants | Chile | 59.6 /100 | #169 | Average 8.9% |
| Kenyans | 58.2 /100 | #170 | Average 8.9% |
| Lebanese | 57.6 /100 | #171 | Average 8.9% |
| Immigrants | Peru | 57.5 /100 | #172 | Average 8.9% |
| Immigrants | Fiji | 56.4 /100 | #173 | Average 8.9% |
| Immigrants | Albania | 50.0 /100 | #174 | Average 9.0% |
| Costa Ricans | 49.3 /100 | #175 | Average 9.0% |
| Immigrants | Syria | 47.5 /100 | #176 | Average 9.0% |
| Hawaiians | 47.2 /100 | #177 | Average 9.0% |
| Immigrants | Cameroon | 47.1 /100 | #178 | Average 9.0% |
| Immigrants | Iraq | 44.4 /100 | #179 | Average 9.1% |
| Immigrants | Uganda | 43.4 /100 | #180 | Average 9.1% |
| Hmong | 40.2 /100 | #181 | Average 9.1% |
| Immigrants | Morocco | 40.2 /100 | #182 | Average 9.1% |
| Uruguayans | 39.2 /100 | #183 | Fair 9.1% |