Bhutanese vs Immigrants from Ireland Average Family Size
COMPARE
Bhutanese
Immigrants from Ireland
Average Family Size
Average Family Size Comparison
Bhutanese
Immigrants from Ireland
3.25
AVERAGE FAMILY SIZE
81.0/ 100
METRIC RATING
143rd/ 347
METRIC RANK
3.13
AVERAGE FAMILY SIZE
0.1/ 100
METRIC RATING
306th/ 347
METRIC RANK
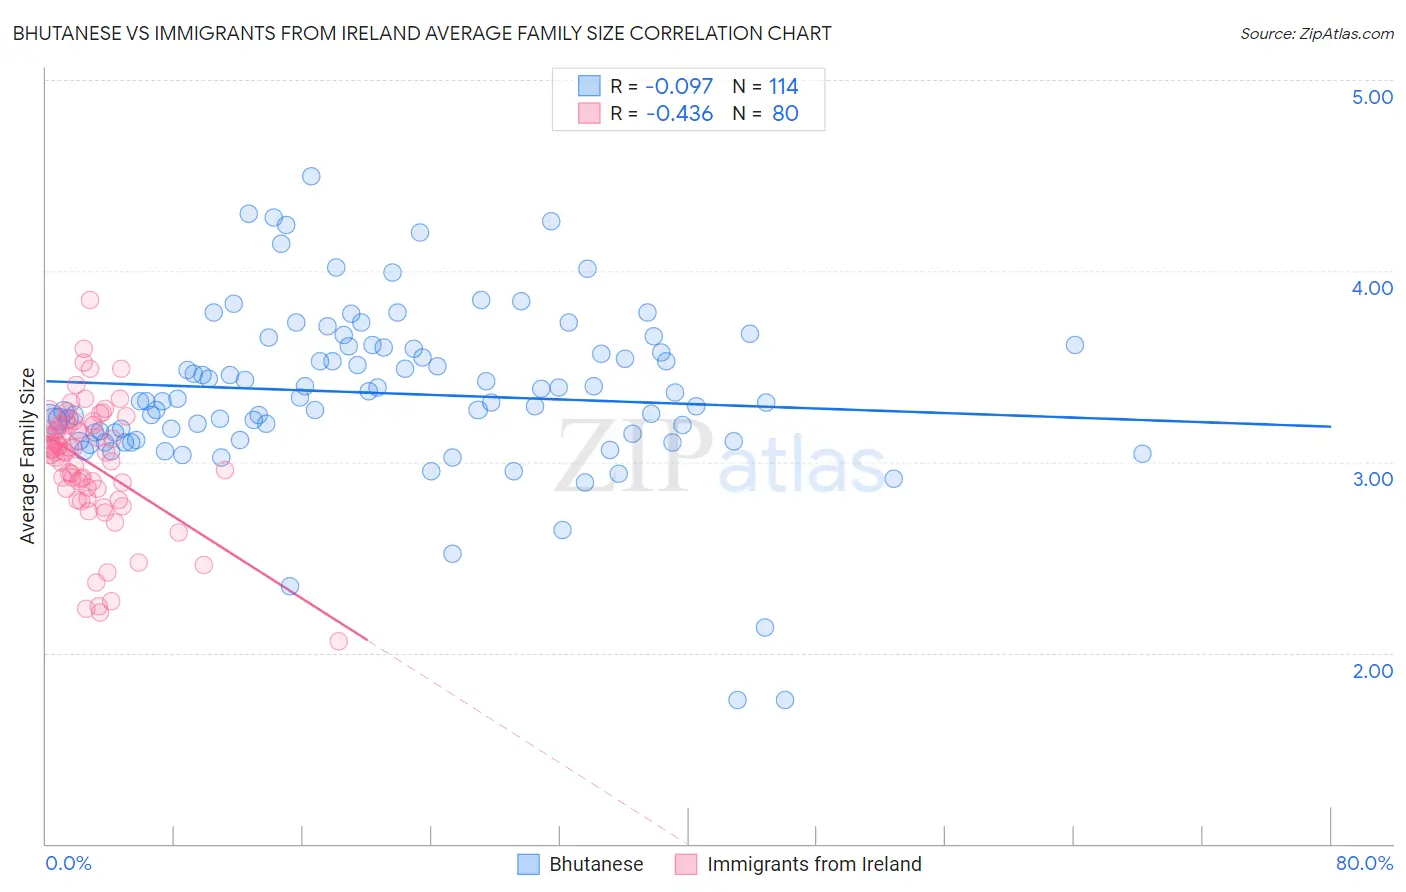
Bhutanese vs Immigrants from Ireland Average Family Size Correlation Chart
The statistical analysis conducted on geographies consisting of 455,147,723 people shows a slight negative correlation between the proportion of Bhutanese and average family size in the United States with a correlation coefficient (R) of -0.097 and weighted average of 3.25. Similarly, the statistical analysis conducted on geographies consisting of 240,751,818 people shows a moderate negative correlation between the proportion of Immigrants from Ireland and average family size in the United States with a correlation coefficient (R) of -0.436 and weighted average of 3.13, a difference of 3.8%.
Average Family Size Correlation Summary
| Measurement | Bhutanese | Immigrants from Ireland |
| Minimum | 1.75 | 2.06 |
| Maximum | 4.49 | 3.85 |
| Range | 2.74 | 1.79 |
| Mean | 3.36 | 2.99 |
| Median | 3.32 | 3.05 |
| Interquartile 25% (IQ1) | 3.15 | 2.86 |
| Interquartile 75% (IQ3) | 3.60 | 3.19 |
| Interquartile Range (IQR) | 0.45 | 0.34 |
| Standard Deviation (Sample) | 0.44 | 0.33 |
| Standard Deviation (Population) | 0.44 | 0.33 |
Similar Demographics by Average Family Size
Demographics Similar to Bhutanese by Average Family Size
In terms of average family size, the demographic groups most similar to Bhutanese are Venezuelan (3.25, a difference of 0.010%), Liberian (3.25, a difference of 0.010%), Immigrants from Ethiopia (3.25, a difference of 0.020%), Subsaharan African (3.25, a difference of 0.020%), and Tsimshian (3.25, a difference of 0.020%).
| Demographics | Rating | Rank | Average Family Size |
| Comanche | 82.8 /100 | #136 | Excellent 3.25 |
| Immigrants | Middle Africa | 82.4 /100 | #137 | Excellent 3.25 |
| Cubans | 81.8 /100 | #138 | Excellent 3.25 |
| Immigrants | Ethiopia | 81.6 /100 | #139 | Excellent 3.25 |
| Sub-Saharan Africans | 81.6 /100 | #140 | Excellent 3.25 |
| Venezuelans | 81.4 /100 | #141 | Excellent 3.25 |
| Liberians | 81.2 /100 | #142 | Excellent 3.25 |
| Bhutanese | 81.0 /100 | #143 | Excellent 3.25 |
| Tsimshian | 80.2 /100 | #144 | Excellent 3.25 |
| Armenians | 78.2 /100 | #145 | Good 3.25 |
| Immigrants | Africa | 77.9 /100 | #146 | Good 3.25 |
| Immigrants | Jordan | 75.7 /100 | #147 | Good 3.24 |
| Blackfeet | 75.0 /100 | #148 | Good 3.24 |
| Assyrians/Chaldeans/Syriacs | 73.8 /100 | #149 | Good 3.24 |
| Indians (Asian) | 73.6 /100 | #150 | Good 3.24 |
Demographics Similar to Immigrants from Ireland by Average Family Size
In terms of average family size, the demographic groups most similar to Immigrants from Ireland are Immigrants from Serbia (3.13, a difference of 0.010%), Slavic (3.13, a difference of 0.060%), Northern European (3.13, a difference of 0.060%), Australian (3.13, a difference of 0.070%), and Immigrants from Switzerland (3.13, a difference of 0.090%).
| Demographics | Rating | Rank | Average Family Size |
| Canadians | 0.2 /100 | #299 | Tragic 3.14 |
| Immigrants | Sweden | 0.2 /100 | #300 | Tragic 3.14 |
| Macedonians | 0.2 /100 | #301 | Tragic 3.13 |
| Immigrants | Latvia | 0.2 /100 | #302 | Tragic 3.13 |
| British | 0.2 /100 | #303 | Tragic 3.13 |
| Immigrants | Switzerland | 0.2 /100 | #304 | Tragic 3.13 |
| Australians | 0.1 /100 | #305 | Tragic 3.13 |
| Immigrants | Ireland | 0.1 /100 | #306 | Tragic 3.13 |
| Immigrants | Serbia | 0.1 /100 | #307 | Tragic 3.13 |
| Slavs | 0.1 /100 | #308 | Tragic 3.13 |
| Northern Europeans | 0.1 /100 | #309 | Tragic 3.13 |
| Czechoslovakians | 0.1 /100 | #310 | Tragic 3.13 |
| Immigrants | Northern Europe | 0.1 /100 | #311 | Tragic 3.13 |
| Immigrants | Australia | 0.1 /100 | #312 | Tragic 3.13 |
| Bulgarians | 0.1 /100 | #313 | Tragic 3.13 |