Bhutanese vs Puget Sound Salish Average Family Size
COMPARE
Bhutanese
Puget Sound Salish
Average Family Size
Average Family Size Comparison
Bhutanese
Puget Sound Salish
3.25
AVERAGE FAMILY SIZE
81.0/ 100
METRIC RATING
143rd/ 347
METRIC RANK
3.17
AVERAGE FAMILY SIZE
1.9/ 100
METRIC RATING
250th/ 347
METRIC RANK
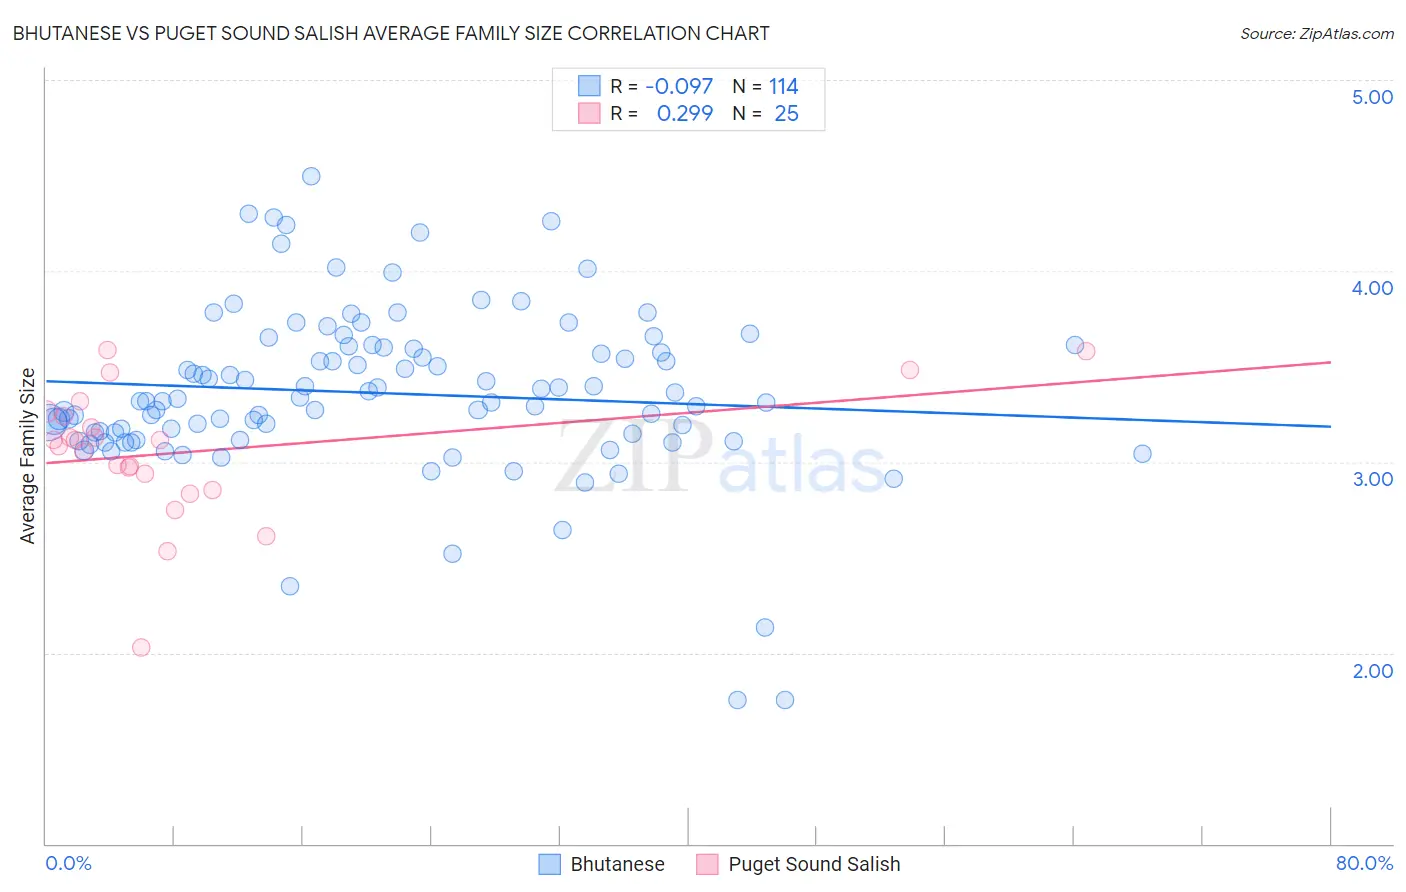
Bhutanese vs Puget Sound Salish Average Family Size Correlation Chart
The statistical analysis conducted on geographies consisting of 455,147,723 people shows a slight negative correlation between the proportion of Bhutanese and average family size in the United States with a correlation coefficient (R) of -0.097 and weighted average of 3.25. Similarly, the statistical analysis conducted on geographies consisting of 46,155,775 people shows a weak positive correlation between the proportion of Puget Sound Salish and average family size in the United States with a correlation coefficient (R) of 0.299 and weighted average of 3.17, a difference of 2.5%.
Average Family Size Correlation Summary
| Measurement | Bhutanese | Puget Sound Salish |
| Minimum | 1.75 | 2.03 |
| Maximum | 4.49 | 3.59 |
| Range | 2.74 | 1.56 |
| Mean | 3.36 | 3.05 |
| Median | 3.32 | 3.11 |
| Interquartile 25% (IQ1) | 3.15 | 2.90 |
| Interquartile 75% (IQ3) | 3.60 | 3.25 |
| Interquartile Range (IQR) | 0.45 | 0.36 |
| Standard Deviation (Sample) | 0.44 | 0.34 |
| Standard Deviation (Population) | 0.44 | 0.34 |
Similar Demographics by Average Family Size
Demographics Similar to Bhutanese by Average Family Size
In terms of average family size, the demographic groups most similar to Bhutanese are Venezuelan (3.25, a difference of 0.010%), Liberian (3.25, a difference of 0.010%), Immigrants from Ethiopia (3.25, a difference of 0.020%), Subsaharan African (3.25, a difference of 0.020%), and Tsimshian (3.25, a difference of 0.020%).
| Demographics | Rating | Rank | Average Family Size |
| Comanche | 82.8 /100 | #136 | Excellent 3.25 |
| Immigrants | Middle Africa | 82.4 /100 | #137 | Excellent 3.25 |
| Cubans | 81.8 /100 | #138 | Excellent 3.25 |
| Immigrants | Ethiopia | 81.6 /100 | #139 | Excellent 3.25 |
| Sub-Saharan Africans | 81.6 /100 | #140 | Excellent 3.25 |
| Venezuelans | 81.4 /100 | #141 | Excellent 3.25 |
| Liberians | 81.2 /100 | #142 | Excellent 3.25 |
| Bhutanese | 81.0 /100 | #143 | Excellent 3.25 |
| Tsimshian | 80.2 /100 | #144 | Excellent 3.25 |
| Armenians | 78.2 /100 | #145 | Good 3.25 |
| Immigrants | Africa | 77.9 /100 | #146 | Good 3.25 |
| Immigrants | Jordan | 75.7 /100 | #147 | Good 3.24 |
| Blackfeet | 75.0 /100 | #148 | Good 3.24 |
| Assyrians/Chaldeans/Syriacs | 73.8 /100 | #149 | Good 3.24 |
| Indians (Asian) | 73.6 /100 | #150 | Good 3.24 |
Demographics Similar to Puget Sound Salish by Average Family Size
In terms of average family size, the demographic groups most similar to Puget Sound Salish are Immigrants from Spain (3.17, a difference of 0.010%), Immigrants from Saudi Arabia (3.17, a difference of 0.040%), South African (3.17, a difference of 0.040%), Immigrants from Hungary (3.17, a difference of 0.050%), and Immigrants from Eastern Europe (3.17, a difference of 0.060%).
| Demographics | Rating | Rank | Average Family Size |
| Immigrants | Moldova | 2.9 /100 | #243 | Tragic 3.18 |
| Immigrants | Southern Europe | 2.9 /100 | #244 | Tragic 3.18 |
| Immigrants | Brazil | 2.7 /100 | #245 | Tragic 3.18 |
| Danes | 2.5 /100 | #246 | Tragic 3.17 |
| Cajuns | 2.4 /100 | #247 | Tragic 3.17 |
| Immigrants | Belarus | 2.3 /100 | #248 | Tragic 3.17 |
| Immigrants | Eastern Europe | 2.1 /100 | #249 | Tragic 3.17 |
| Puget Sound Salish | 1.9 /100 | #250 | Tragic 3.17 |
| Immigrants | Spain | 1.8 /100 | #251 | Tragic 3.17 |
| Immigrants | Saudi Arabia | 1.7 /100 | #252 | Tragic 3.17 |
| South Africans | 1.7 /100 | #253 | Tragic 3.17 |
| Immigrants | Hungary | 1.7 /100 | #254 | Tragic 3.17 |
| Cape Verdeans | 1.6 /100 | #255 | Tragic 3.17 |
| Immigrants | Kazakhstan | 1.5 /100 | #256 | Tragic 3.17 |
| Albanians | 1.5 /100 | #257 | Tragic 3.17 |