Bhutanese vs Immigrants from Ireland Median Household Income
COMPARE
Bhutanese
Immigrants from Ireland
Median Household Income
Median Household Income Comparison
Bhutanese
Immigrants from Ireland
$100,151
MEDIAN HOUSEHOLD INCOME
100.0/ 100
METRIC RATING
27th/ 347
METRIC RANK
$104,692
MEDIAN HOUSEHOLD INCOME
100.0/ 100
METRIC RATING
14th/ 347
METRIC RANK
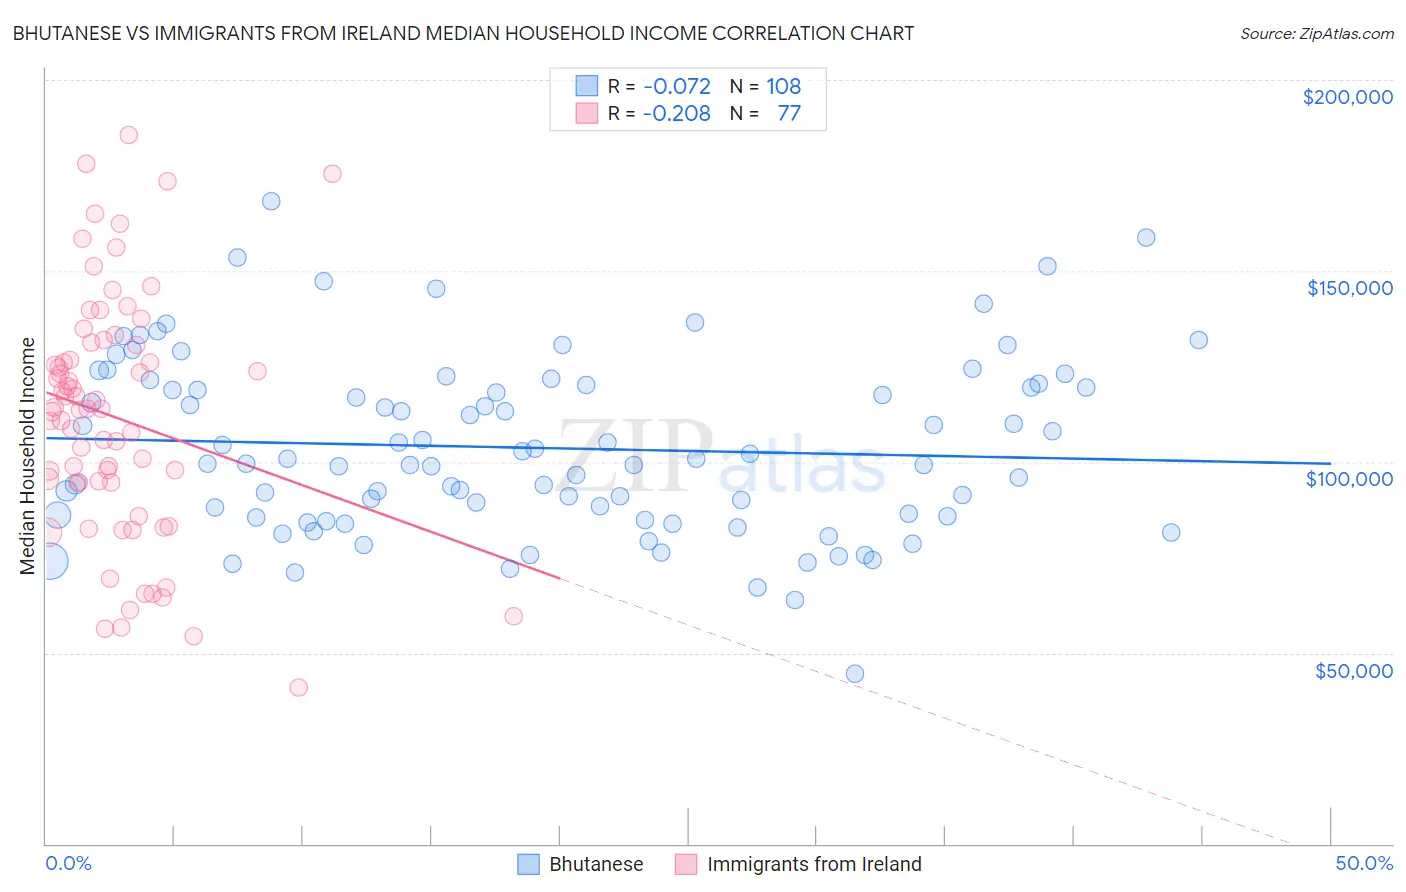
Bhutanese vs Immigrants from Ireland Median Household Income Correlation Chart
The statistical analysis conducted on geographies consisting of 455,036,820 people shows a slight negative correlation between the proportion of Bhutanese and median household income in the United States with a correlation coefficient (R) of -0.072 and weighted average of $100,151. Similarly, the statistical analysis conducted on geographies consisting of 240,715,462 people shows a weak negative correlation between the proportion of Immigrants from Ireland and median household income in the United States with a correlation coefficient (R) of -0.208 and weighted average of $104,692, a difference of 4.5%.
Median Household Income Correlation Summary
| Measurement | Bhutanese | Immigrants from Ireland |
| Minimum | $44,611 | $40,962 |
| Maximum | $168,247 | $185,464 |
| Range | $123,636 | $144,502 |
| Mean | $103,677 | $111,627 |
| Median | $100,131 | $113,820 |
| Interquartile 25% (IQ1) | $85,552 | $94,548 |
| Interquartile 75% (IQ3) | $119,777 | $130,997 |
| Interquartile Range (IQR) | $34,225 | $36,449 |
| Standard Deviation (Sample) | $23,044 | $31,764 |
| Standard Deviation (Population) | $22,937 | $31,557 |
Demographics Similar to Bhutanese and Immigrants from Ireland by Median Household Income
In terms of median household income, the demographic groups most similar to Bhutanese are Immigrants from Belgium ($100,306, a difference of 0.15%), Immigrants from Sri Lanka ($99,943, a difference of 0.21%), Immigrants from Asia ($99,933, a difference of 0.22%), Immigrants from Northern Europe ($99,813, a difference of 0.34%), and Immigrants from Sweden ($100,699, a difference of 0.55%). Similarly, the demographic groups most similar to Immigrants from Ireland are Immigrants from Eastern Asia ($104,796, a difference of 0.10%), Indian (Asian) ($105,262, a difference of 0.54%), Immigrants from Israel ($104,090, a difference of 0.58%), Immigrants from China ($105,335, a difference of 0.61%), and Immigrants from South Central Asia ($106,057, a difference of 1.3%).
| Demographics | Rating | Rank | Median Household Income |
| Immigrants | South Central Asia | 100.0 /100 | #10 | Exceptional $106,057 |
| Immigrants | China | 100.0 /100 | #11 | Exceptional $105,335 |
| Indians (Asian) | 100.0 /100 | #12 | Exceptional $105,262 |
| Immigrants | Eastern Asia | 100.0 /100 | #13 | Exceptional $104,796 |
| Immigrants | Ireland | 100.0 /100 | #14 | Exceptional $104,692 |
| Immigrants | Israel | 100.0 /100 | #15 | Exceptional $104,090 |
| Burmese | 100.0 /100 | #16 | Exceptional $103,145 |
| Immigrants | Korea | 100.0 /100 | #17 | Exceptional $102,962 |
| Cypriots | 100.0 /100 | #18 | Exceptional $102,843 |
| Immigrants | Australia | 100.0 /100 | #19 | Exceptional $102,562 |
| Bolivians | 100.0 /100 | #20 | Exceptional $102,195 |
| Eastern Europeans | 100.0 /100 | #21 | Exceptional $101,781 |
| Asians | 100.0 /100 | #22 | Exceptional $101,681 |
| Immigrants | Bolivia | 100.0 /100 | #23 | Exceptional $101,394 |
| Immigrants | Japan | 100.0 /100 | #24 | Exceptional $100,711 |
| Immigrants | Sweden | 100.0 /100 | #25 | Exceptional $100,699 |
| Immigrants | Belgium | 100.0 /100 | #26 | Exceptional $100,306 |
| Bhutanese | 100.0 /100 | #27 | Exceptional $100,151 |
| Immigrants | Sri Lanka | 100.0 /100 | #28 | Exceptional $99,943 |
| Immigrants | Asia | 100.0 /100 | #29 | Exceptional $99,933 |
| Immigrants | Northern Europe | 100.0 /100 | #30 | Exceptional $99,813 |