Ugandan vs Immigrants from Ireland Average Family Size
COMPARE
Ugandan
Immigrants from Ireland
Average Family Size
Average Family Size Comparison
Ugandans
Immigrants from Ireland
3.23
AVERAGE FAMILY SIZE
58.4/ 100
METRIC RATING
165th/ 347
METRIC RANK
3.13
AVERAGE FAMILY SIZE
0.1/ 100
METRIC RATING
306th/ 347
METRIC RANK
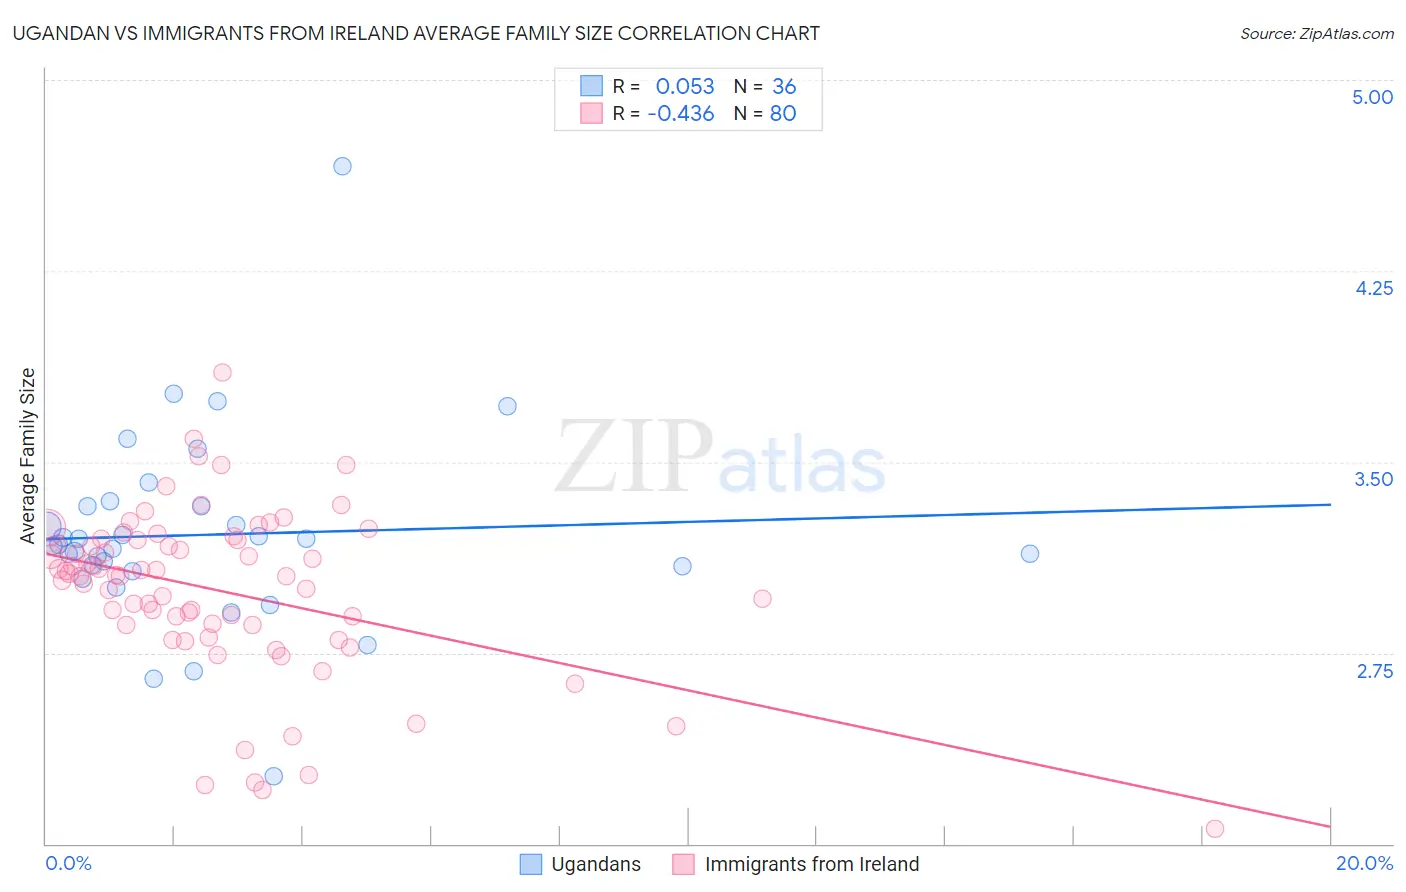
Ugandan vs Immigrants from Ireland Average Family Size Correlation Chart
The statistical analysis conducted on geographies consisting of 93,998,632 people shows a slight positive correlation between the proportion of Ugandans and average family size in the United States with a correlation coefficient (R) of 0.053 and weighted average of 3.23. Similarly, the statistical analysis conducted on geographies consisting of 240,751,818 people shows a moderate negative correlation between the proportion of Immigrants from Ireland and average family size in the United States with a correlation coefficient (R) of -0.436 and weighted average of 3.13, a difference of 3.3%.
Average Family Size Correlation Summary
| Measurement | Ugandan | Immigrants from Ireland |
| Minimum | 2.26 | 2.06 |
| Maximum | 4.66 | 3.85 |
| Range | 2.40 | 1.79 |
| Mean | 3.21 | 2.99 |
| Median | 3.17 | 3.05 |
| Interquartile 25% (IQ1) | 3.08 | 2.86 |
| Interquartile 75% (IQ3) | 3.33 | 3.19 |
| Interquartile Range (IQR) | 0.25 | 0.34 |
| Standard Deviation (Sample) | 0.39 | 0.33 |
| Standard Deviation (Population) | 0.38 | 0.33 |
Similar Demographics by Average Family Size
Demographics Similar to Ugandans by Average Family Size
In terms of average family size, the demographic groups most similar to Ugandans are Egyptian (3.23, a difference of 0.0%), Uruguayan (3.23, a difference of 0.010%), Immigrants from Senegal (3.23, a difference of 0.020%), Immigrants from Uganda (3.23, a difference of 0.030%), and Dutch West Indian (3.23, a difference of 0.030%).
| Demographics | Rating | Rank | Average Family Size |
| Iraqis | 64.3 /100 | #158 | Good 3.24 |
| Ethiopians | 63.9 /100 | #159 | Good 3.24 |
| Immigrants | Iraq | 63.7 /100 | #160 | Good 3.24 |
| Immigrants | Chile | 63.2 /100 | #161 | Good 3.24 |
| Immigrants | Uganda | 60.1 /100 | #162 | Good 3.23 |
| Uruguayans | 58.8 /100 | #163 | Average 3.23 |
| Egyptians | 58.6 /100 | #164 | Average 3.23 |
| Ugandans | 58.4 /100 | #165 | Average 3.23 |
| Immigrants | Senegal | 57.5 /100 | #166 | Average 3.23 |
| Dutch West Indians | 56.9 /100 | #167 | Average 3.23 |
| Taiwanese | 54.2 /100 | #168 | Average 3.23 |
| Aleuts | 54.1 /100 | #169 | Average 3.23 |
| Arabs | 53.8 /100 | #170 | Average 3.23 |
| Chileans | 53.2 /100 | #171 | Average 3.23 |
| Immigrants | Congo | 52.7 /100 | #172 | Average 3.23 |
Demographics Similar to Immigrants from Ireland by Average Family Size
In terms of average family size, the demographic groups most similar to Immigrants from Ireland are Immigrants from Serbia (3.13, a difference of 0.010%), Slavic (3.13, a difference of 0.060%), Northern European (3.13, a difference of 0.060%), Australian (3.13, a difference of 0.070%), and Immigrants from Switzerland (3.13, a difference of 0.090%).
| Demographics | Rating | Rank | Average Family Size |
| Canadians | 0.2 /100 | #299 | Tragic 3.14 |
| Immigrants | Sweden | 0.2 /100 | #300 | Tragic 3.14 |
| Macedonians | 0.2 /100 | #301 | Tragic 3.13 |
| Immigrants | Latvia | 0.2 /100 | #302 | Tragic 3.13 |
| British | 0.2 /100 | #303 | Tragic 3.13 |
| Immigrants | Switzerland | 0.2 /100 | #304 | Tragic 3.13 |
| Australians | 0.1 /100 | #305 | Tragic 3.13 |
| Immigrants | Ireland | 0.1 /100 | #306 | Tragic 3.13 |
| Immigrants | Serbia | 0.1 /100 | #307 | Tragic 3.13 |
| Slavs | 0.1 /100 | #308 | Tragic 3.13 |
| Northern Europeans | 0.1 /100 | #309 | Tragic 3.13 |
| Czechoslovakians | 0.1 /100 | #310 | Tragic 3.13 |
| Immigrants | Northern Europe | 0.1 /100 | #311 | Tragic 3.13 |
| Immigrants | Australia | 0.1 /100 | #312 | Tragic 3.13 |
| Bulgarians | 0.1 /100 | #313 | Tragic 3.13 |