Mexican vs Immigrants from Ireland Average Family Size
COMPARE
Mexican
Immigrants from Ireland
Average Family Size
Average Family Size Comparison
Mexicans
Immigrants from Ireland
3.48
AVERAGE FAMILY SIZE
100.0/ 100
METRIC RATING
19th/ 347
METRIC RANK
3.13
AVERAGE FAMILY SIZE
0.1/ 100
METRIC RATING
306th/ 347
METRIC RANK
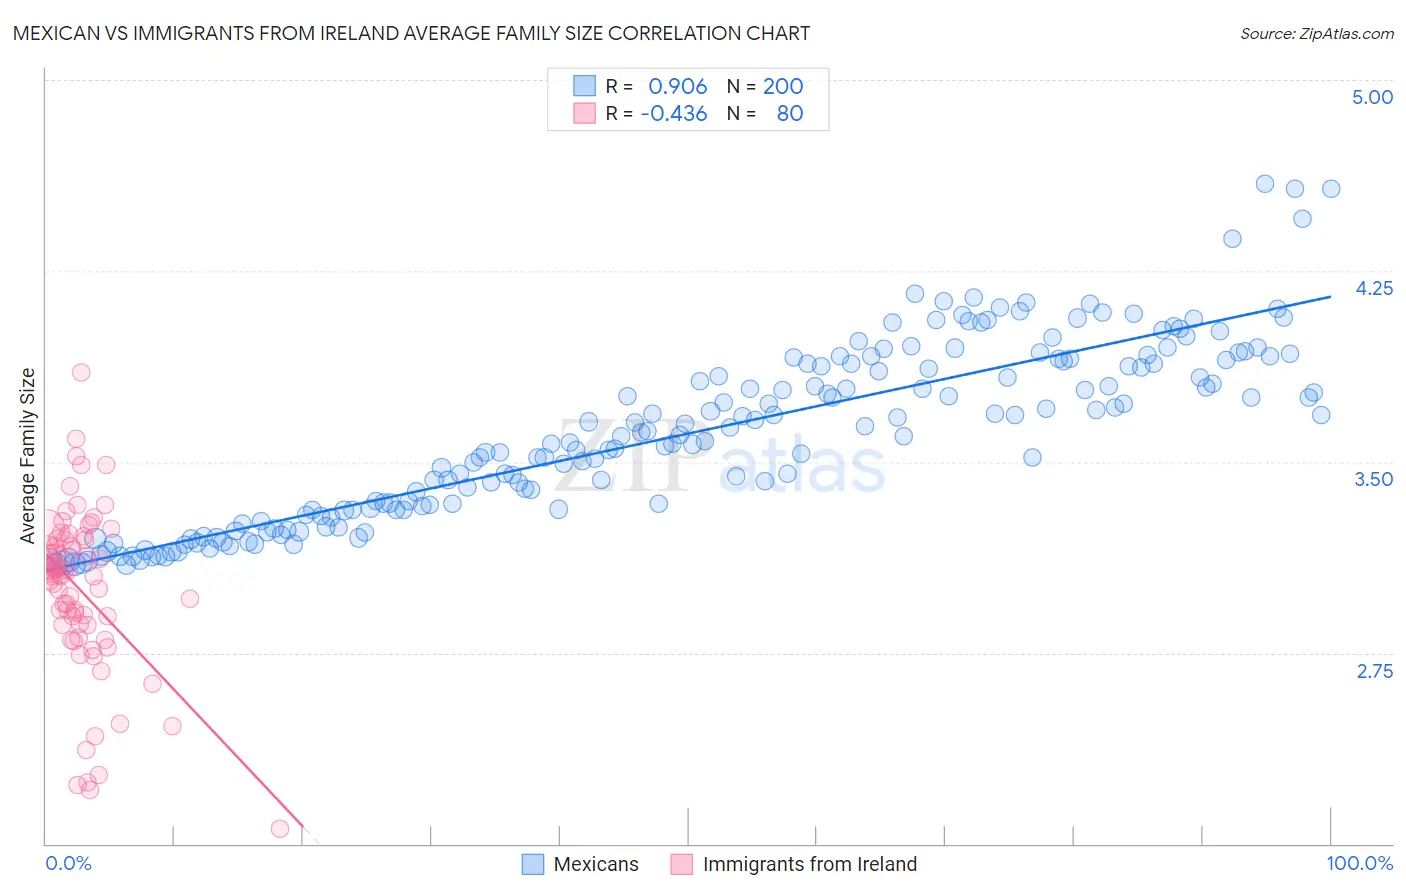
Mexican vs Immigrants from Ireland Average Family Size Correlation Chart
The statistical analysis conducted on geographies consisting of 564,667,700 people shows a near-perfect positive correlation between the proportion of Mexicans and average family size in the United States with a correlation coefficient (R) of 0.906 and weighted average of 3.48. Similarly, the statistical analysis conducted on geographies consisting of 240,751,818 people shows a moderate negative correlation between the proportion of Immigrants from Ireland and average family size in the United States with a correlation coefficient (R) of -0.436 and weighted average of 3.13, a difference of 11.0%.
Average Family Size Correlation Summary
| Measurement | Mexican | Immigrants from Ireland |
| Minimum | 3.09 | 2.06 |
| Maximum | 4.59 | 3.85 |
| Range | 1.50 | 1.79 |
| Mean | 3.61 | 2.99 |
| Median | 3.60 | 3.05 |
| Interquartile 25% (IQ1) | 3.31 | 2.86 |
| Interquartile 75% (IQ3) | 3.89 | 3.19 |
| Interquartile Range (IQR) | 0.58 | 0.34 |
| Standard Deviation (Sample) | 0.34 | 0.33 |
| Standard Deviation (Population) | 0.34 | 0.33 |
Similar Demographics by Average Family Size
Demographics Similar to Mexicans by Average Family Size
In terms of average family size, the demographic groups most similar to Mexicans are Cheyenne (3.47, a difference of 0.040%), Salvadoran (3.48, a difference of 0.070%), Yuman (3.47, a difference of 0.30%), Immigrants from El Salvador (3.49, a difference of 0.32%), and Apache (3.46, a difference of 0.35%).
| Demographics | Rating | Rank | Average Family Size |
| Immigrants | Mexico | 100.0 /100 | #12 | Exceptional 3.52 |
| Sioux | 100.0 /100 | #13 | Exceptional 3.52 |
| Immigrants | Central America | 100.0 /100 | #14 | Exceptional 3.49 |
| Tongans | 100.0 /100 | #15 | Exceptional 3.49 |
| Ute | 100.0 /100 | #16 | Exceptional 3.49 |
| Immigrants | El Salvador | 100.0 /100 | #17 | Exceptional 3.49 |
| Salvadorans | 100.0 /100 | #18 | Exceptional 3.48 |
| Mexicans | 100.0 /100 | #19 | Exceptional 3.48 |
| Cheyenne | 100.0 /100 | #20 | Exceptional 3.47 |
| Yuman | 100.0 /100 | #21 | Exceptional 3.47 |
| Apache | 100.0 /100 | #22 | Exceptional 3.46 |
| Immigrants | Fiji | 100.0 /100 | #23 | Exceptional 3.45 |
| Natives/Alaskans | 100.0 /100 | #24 | Exceptional 3.45 |
| Yakama | 100.0 /100 | #25 | Exceptional 3.45 |
| Native Hawaiians | 100.0 /100 | #26 | Exceptional 3.43 |
Demographics Similar to Immigrants from Ireland by Average Family Size
In terms of average family size, the demographic groups most similar to Immigrants from Ireland are Immigrants from Serbia (3.13, a difference of 0.010%), Slavic (3.13, a difference of 0.060%), Northern European (3.13, a difference of 0.060%), Australian (3.13, a difference of 0.070%), and Immigrants from Switzerland (3.13, a difference of 0.090%).
| Demographics | Rating | Rank | Average Family Size |
| Canadians | 0.2 /100 | #299 | Tragic 3.14 |
| Immigrants | Sweden | 0.2 /100 | #300 | Tragic 3.14 |
| Macedonians | 0.2 /100 | #301 | Tragic 3.13 |
| Immigrants | Latvia | 0.2 /100 | #302 | Tragic 3.13 |
| British | 0.2 /100 | #303 | Tragic 3.13 |
| Immigrants | Switzerland | 0.2 /100 | #304 | Tragic 3.13 |
| Australians | 0.1 /100 | #305 | Tragic 3.13 |
| Immigrants | Ireland | 0.1 /100 | #306 | Tragic 3.13 |
| Immigrants | Serbia | 0.1 /100 | #307 | Tragic 3.13 |
| Slavs | 0.1 /100 | #308 | Tragic 3.13 |
| Northern Europeans | 0.1 /100 | #309 | Tragic 3.13 |
| Czechoslovakians | 0.1 /100 | #310 | Tragic 3.13 |
| Immigrants | Northern Europe | 0.1 /100 | #311 | Tragic 3.13 |
| Immigrants | Australia | 0.1 /100 | #312 | Tragic 3.13 |
| Bulgarians | 0.1 /100 | #313 | Tragic 3.13 |