Bhutanese vs Immigrants from Bulgaria Average Family Size
COMPARE
Bhutanese
Immigrants from Bulgaria
Average Family Size
Average Family Size Comparison
Bhutanese
Immigrants from Bulgaria
3.25
AVERAGE FAMILY SIZE
81.0/ 100
METRIC RATING
143rd/ 347
METRIC RANK
3.16
AVERAGE FAMILY SIZE
1.0/ 100
METRIC RATING
263rd/ 347
METRIC RANK
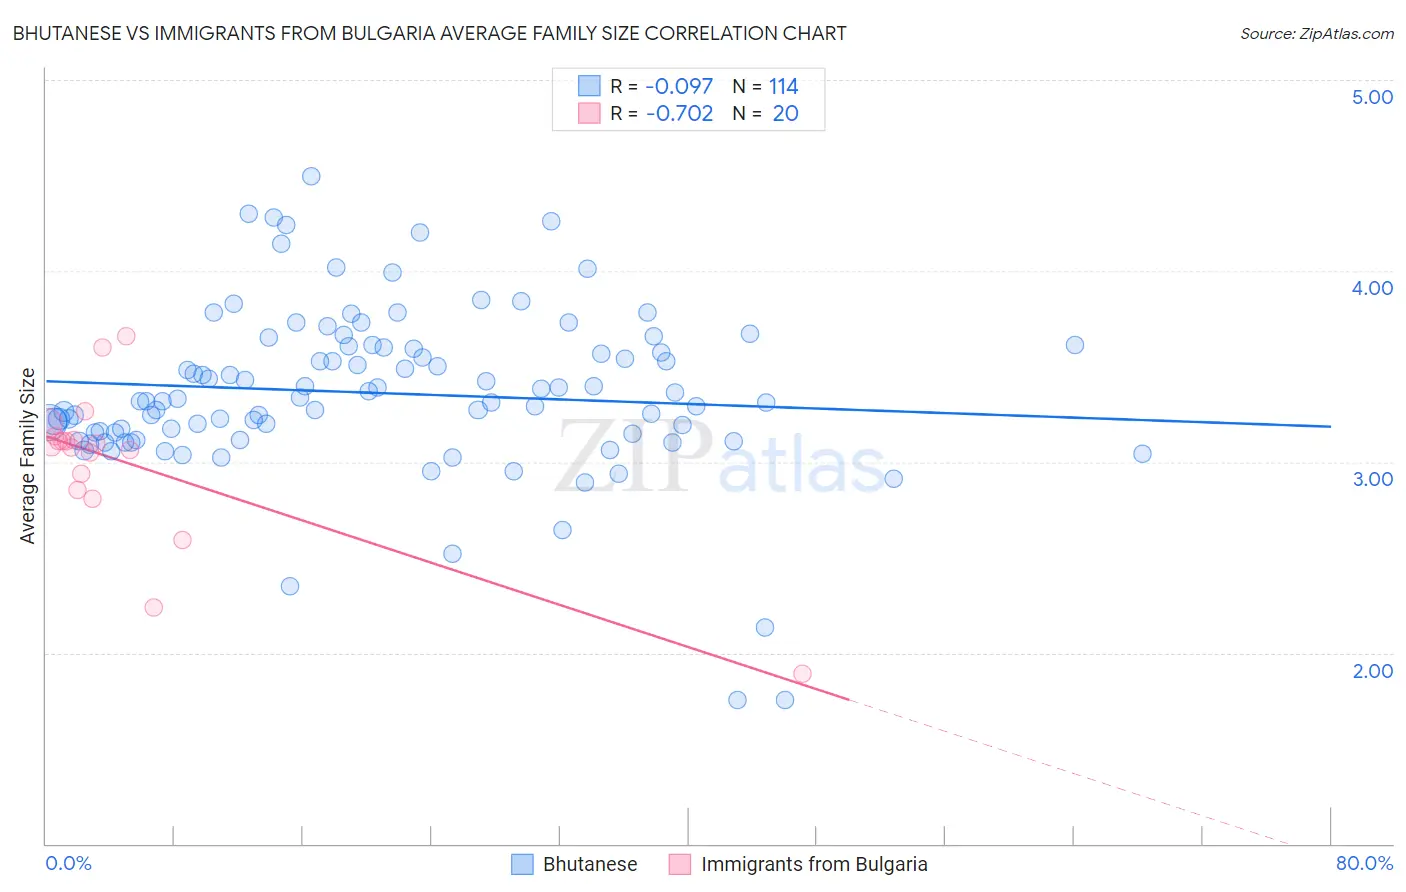
Bhutanese vs Immigrants from Bulgaria Average Family Size Correlation Chart
The statistical analysis conducted on geographies consisting of 455,147,723 people shows a slight negative correlation between the proportion of Bhutanese and average family size in the United States with a correlation coefficient (R) of -0.097 and weighted average of 3.25. Similarly, the statistical analysis conducted on geographies consisting of 172,540,373 people shows a strong negative correlation between the proportion of Immigrants from Bulgaria and average family size in the United States with a correlation coefficient (R) of -0.702 and weighted average of 3.16, a difference of 2.8%.
Average Family Size Correlation Summary
| Measurement | Bhutanese | Immigrants from Bulgaria |
| Minimum | 1.75 | 1.89 |
| Maximum | 4.49 | 3.66 |
| Range | 2.74 | 1.77 |
| Mean | 3.36 | 3.00 |
| Median | 3.32 | 3.09 |
| Interquartile 25% (IQ1) | 3.15 | 2.89 |
| Interquartile 75% (IQ3) | 3.60 | 3.12 |
| Interquartile Range (IQR) | 0.45 | 0.23 |
| Standard Deviation (Sample) | 0.44 | 0.40 |
| Standard Deviation (Population) | 0.44 | 0.39 |
Similar Demographics by Average Family Size
Demographics Similar to Bhutanese by Average Family Size
In terms of average family size, the demographic groups most similar to Bhutanese are Venezuelan (3.25, a difference of 0.010%), Liberian (3.25, a difference of 0.010%), Immigrants from Ethiopia (3.25, a difference of 0.020%), Subsaharan African (3.25, a difference of 0.020%), and Tsimshian (3.25, a difference of 0.020%).
| Demographics | Rating | Rank | Average Family Size |
| Comanche | 82.8 /100 | #136 | Excellent 3.25 |
| Immigrants | Middle Africa | 82.4 /100 | #137 | Excellent 3.25 |
| Cubans | 81.8 /100 | #138 | Excellent 3.25 |
| Immigrants | Ethiopia | 81.6 /100 | #139 | Excellent 3.25 |
| Sub-Saharan Africans | 81.6 /100 | #140 | Excellent 3.25 |
| Venezuelans | 81.4 /100 | #141 | Excellent 3.25 |
| Liberians | 81.2 /100 | #142 | Excellent 3.25 |
| Bhutanese | 81.0 /100 | #143 | Excellent 3.25 |
| Tsimshian | 80.2 /100 | #144 | Excellent 3.25 |
| Armenians | 78.2 /100 | #145 | Good 3.25 |
| Immigrants | Africa | 77.9 /100 | #146 | Good 3.25 |
| Immigrants | Jordan | 75.7 /100 | #147 | Good 3.24 |
| Blackfeet | 75.0 /100 | #148 | Good 3.24 |
| Assyrians/Chaldeans/Syriacs | 73.8 /100 | #149 | Good 3.24 |
| Indians (Asian) | 73.6 /100 | #150 | Good 3.24 |
Demographics Similar to Immigrants from Bulgaria by Average Family Size
In terms of average family size, the demographic groups most similar to Immigrants from Bulgaria are American (3.16, a difference of 0.020%), Immigrants from South Africa (3.16, a difference of 0.070%), Immigrants from Greece (3.16, a difference of 0.080%), Immigrants from North Macedonia (3.16, a difference of 0.10%), and Immigrants from Russia (3.16, a difference of 0.10%).
| Demographics | Rating | Rank | Average Family Size |
| Immigrants | Kazakhstan | 1.5 /100 | #256 | Tragic 3.17 |
| Albanians | 1.5 /100 | #257 | Tragic 3.17 |
| Turks | 1.3 /100 | #258 | Tragic 3.16 |
| Potawatomi | 1.3 /100 | #259 | Tragic 3.16 |
| Immigrants | Albania | 1.3 /100 | #260 | Tragic 3.16 |
| Immigrants | North Macedonia | 1.3 /100 | #261 | Tragic 3.16 |
| Immigrants | Russia | 1.3 /100 | #262 | Tragic 3.16 |
| Immigrants | Bulgaria | 1.0 /100 | #263 | Tragic 3.16 |
| Americans | 1.0 /100 | #264 | Tragic 3.16 |
| Immigrants | South Africa | 0.9 /100 | #265 | Tragic 3.16 |
| Immigrants | Greece | 0.9 /100 | #266 | Tragic 3.16 |
| Iroquois | 0.8 /100 | #267 | Tragic 3.16 |
| Maltese | 0.8 /100 | #268 | Tragic 3.16 |
| Immigrants | Singapore | 0.7 /100 | #269 | Tragic 3.16 |
| Tlingit-Haida | 0.7 /100 | #270 | Tragic 3.16 |