Bolivian vs Immigrants from Ireland Average Family Size
COMPARE
Bolivian
Immigrants from Ireland
Average Family Size
Average Family Size Comparison
Bolivians
Immigrants from Ireland
3.29
AVERAGE FAMILY SIZE
98.3/ 100
METRIC RATING
104th/ 347
METRIC RANK
3.13
AVERAGE FAMILY SIZE
0.1/ 100
METRIC RATING
306th/ 347
METRIC RANK
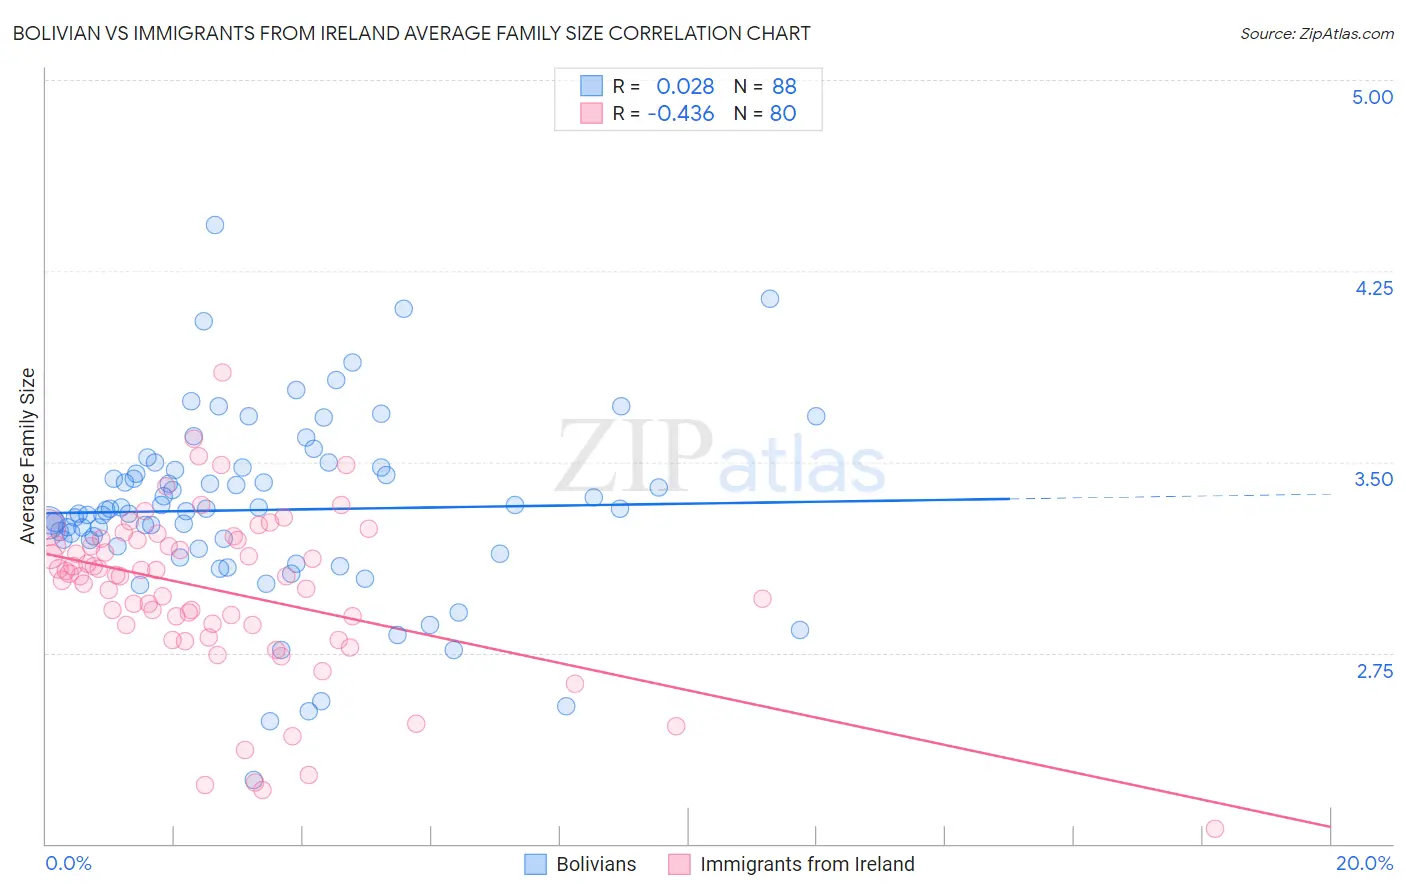
Bolivian vs Immigrants from Ireland Average Family Size Correlation Chart
The statistical analysis conducted on geographies consisting of 184,628,793 people shows no correlation between the proportion of Bolivians and average family size in the United States with a correlation coefficient (R) of 0.028 and weighted average of 3.29. Similarly, the statistical analysis conducted on geographies consisting of 240,751,818 people shows a moderate negative correlation between the proportion of Immigrants from Ireland and average family size in the United States with a correlation coefficient (R) of -0.436 and weighted average of 3.13, a difference of 5.0%.
Average Family Size Correlation Summary
| Measurement | Bolivian | Immigrants from Ireland |
| Minimum | 2.25 | 2.06 |
| Maximum | 4.43 | 3.85 |
| Range | 2.18 | 1.79 |
| Mean | 3.31 | 2.99 |
| Median | 3.31 | 3.05 |
| Interquartile 25% (IQ1) | 3.16 | 2.86 |
| Interquartile 75% (IQ3) | 3.47 | 3.19 |
| Interquartile Range (IQR) | 0.31 | 0.34 |
| Standard Deviation (Sample) | 0.36 | 0.33 |
| Standard Deviation (Population) | 0.36 | 0.33 |
Similar Demographics by Average Family Size
Demographics Similar to Bolivians by Average Family Size
In terms of average family size, the demographic groups most similar to Bolivians are Immigrants from Western Africa (3.29, a difference of 0.040%), Immigrants from Ghana (3.29, a difference of 0.050%), Immigrants from Burma/Myanmar (3.29, a difference of 0.070%), West Indian (3.29, a difference of 0.070%), and Paiute (3.29, a difference of 0.070%).
| Demographics | Rating | Rank | Average Family Size |
| Immigrants | Oceania | 98.7 /100 | #97 | Exceptional 3.29 |
| Barbadians | 98.6 /100 | #98 | Exceptional 3.29 |
| Nigerians | 98.6 /100 | #99 | Exceptional 3.29 |
| Guamanians/Chamorros | 98.6 /100 | #100 | Exceptional 3.29 |
| Immigrants | Burma/Myanmar | 98.6 /100 | #101 | Exceptional 3.29 |
| West Indians | 98.5 /100 | #102 | Exceptional 3.29 |
| Immigrants | Western Africa | 98.4 /100 | #103 | Exceptional 3.29 |
| Bolivians | 98.3 /100 | #104 | Exceptional 3.29 |
| Immigrants | Ghana | 98.1 /100 | #105 | Exceptional 3.29 |
| Paiute | 98.0 /100 | #106 | Exceptional 3.29 |
| Ghanaians | 98.0 /100 | #107 | Exceptional 3.29 |
| Asians | 97.0 /100 | #108 | Exceptional 3.28 |
| Puerto Ricans | 96.7 /100 | #109 | Exceptional 3.28 |
| Bahamians | 96.6 /100 | #110 | Exceptional 3.28 |
| Indonesians | 96.2 /100 | #111 | Exceptional 3.28 |
Demographics Similar to Immigrants from Ireland by Average Family Size
In terms of average family size, the demographic groups most similar to Immigrants from Ireland are Immigrants from Serbia (3.13, a difference of 0.010%), Slavic (3.13, a difference of 0.060%), Northern European (3.13, a difference of 0.060%), Australian (3.13, a difference of 0.070%), and Immigrants from Switzerland (3.13, a difference of 0.090%).
| Demographics | Rating | Rank | Average Family Size |
| Canadians | 0.2 /100 | #299 | Tragic 3.14 |
| Immigrants | Sweden | 0.2 /100 | #300 | Tragic 3.14 |
| Macedonians | 0.2 /100 | #301 | Tragic 3.13 |
| Immigrants | Latvia | 0.2 /100 | #302 | Tragic 3.13 |
| British | 0.2 /100 | #303 | Tragic 3.13 |
| Immigrants | Switzerland | 0.2 /100 | #304 | Tragic 3.13 |
| Australians | 0.1 /100 | #305 | Tragic 3.13 |
| Immigrants | Ireland | 0.1 /100 | #306 | Tragic 3.13 |
| Immigrants | Serbia | 0.1 /100 | #307 | Tragic 3.13 |
| Slavs | 0.1 /100 | #308 | Tragic 3.13 |
| Northern Europeans | 0.1 /100 | #309 | Tragic 3.13 |
| Czechoslovakians | 0.1 /100 | #310 | Tragic 3.13 |
| Immigrants | Northern Europe | 0.1 /100 | #311 | Tragic 3.13 |
| Immigrants | Australia | 0.1 /100 | #312 | Tragic 3.13 |
| Bulgarians | 0.1 /100 | #313 | Tragic 3.13 |