Bhutanese vs Peruvian Average Family Size
COMPARE
Bhutanese
Peruvian
Average Family Size
Average Family Size Comparison
Bhutanese
Peruvians
3.25
AVERAGE FAMILY SIZE
81.0/ 100
METRIC RATING
143rd/ 347
METRIC RANK
3.30
AVERAGE FAMILY SIZE
99.2/ 100
METRIC RATING
93rd/ 347
METRIC RANK
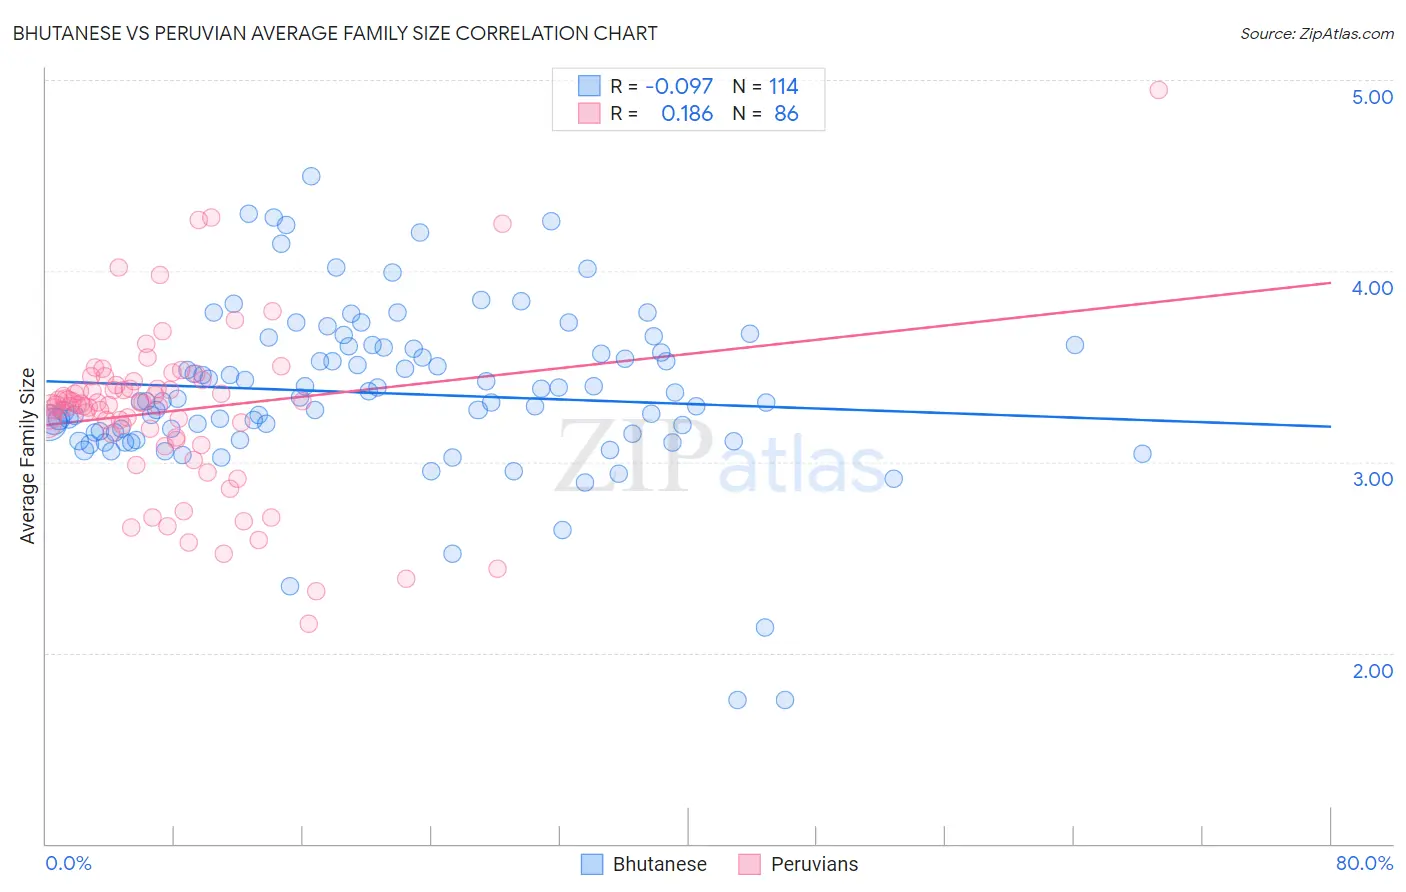
Bhutanese vs Peruvian Average Family Size Correlation Chart
The statistical analysis conducted on geographies consisting of 455,147,723 people shows a slight negative correlation between the proportion of Bhutanese and average family size in the United States with a correlation coefficient (R) of -0.097 and weighted average of 3.25. Similarly, the statistical analysis conducted on geographies consisting of 362,986,655 people shows a poor positive correlation between the proportion of Peruvians and average family size in the United States with a correlation coefficient (R) of 0.186 and weighted average of 3.30, a difference of 1.5%.
Average Family Size Correlation Summary
| Measurement | Bhutanese | Peruvian |
| Minimum | 1.75 | 2.15 |
| Maximum | 4.49 | 4.95 |
| Range | 2.74 | 2.80 |
| Mean | 3.36 | 3.27 |
| Median | 3.32 | 3.30 |
| Interquartile 25% (IQ1) | 3.15 | 3.13 |
| Interquartile 75% (IQ3) | 3.60 | 3.40 |
| Interquartile Range (IQR) | 0.45 | 0.27 |
| Standard Deviation (Sample) | 0.44 | 0.43 |
| Standard Deviation (Population) | 0.44 | 0.43 |
Similar Demographics by Average Family Size
Demographics Similar to Bhutanese by Average Family Size
In terms of average family size, the demographic groups most similar to Bhutanese are Venezuelan (3.25, a difference of 0.010%), Liberian (3.25, a difference of 0.010%), Immigrants from Ethiopia (3.25, a difference of 0.020%), Subsaharan African (3.25, a difference of 0.020%), and Tsimshian (3.25, a difference of 0.020%).
| Demographics | Rating | Rank | Average Family Size |
| Comanche | 82.8 /100 | #136 | Excellent 3.25 |
| Immigrants | Middle Africa | 82.4 /100 | #137 | Excellent 3.25 |
| Cubans | 81.8 /100 | #138 | Excellent 3.25 |
| Immigrants | Ethiopia | 81.6 /100 | #139 | Excellent 3.25 |
| Sub-Saharan Africans | 81.6 /100 | #140 | Excellent 3.25 |
| Venezuelans | 81.4 /100 | #141 | Excellent 3.25 |
| Liberians | 81.2 /100 | #142 | Excellent 3.25 |
| Bhutanese | 81.0 /100 | #143 | Excellent 3.25 |
| Tsimshian | 80.2 /100 | #144 | Excellent 3.25 |
| Armenians | 78.2 /100 | #145 | Good 3.25 |
| Immigrants | Africa | 77.9 /100 | #146 | Good 3.25 |
| Immigrants | Jordan | 75.7 /100 | #147 | Good 3.24 |
| Blackfeet | 75.0 /100 | #148 | Good 3.24 |
| Assyrians/Chaldeans/Syriacs | 73.8 /100 | #149 | Good 3.24 |
| Indians (Asian) | 73.6 /100 | #150 | Good 3.24 |
Demographics Similar to Peruvians by Average Family Size
In terms of average family size, the demographic groups most similar to Peruvians are Immigrants from Cameroon (3.30, a difference of 0.010%), Immigrants from Pakistan (3.30, a difference of 0.020%), Sierra Leonean (3.30, a difference of 0.10%), Immigrants from Lebanon (3.30, a difference of 0.11%), and Menominee (3.30, a difference of 0.17%).
| Demographics | Rating | Rank | Average Family Size |
| Jamaicans | 99.7 /100 | #86 | Exceptional 3.31 |
| Immigrants | Peru | 99.7 /100 | #87 | Exceptional 3.31 |
| Immigrants | Bolivia | 99.6 /100 | #88 | Exceptional 3.31 |
| Malaysians | 99.6 /100 | #89 | Exceptional 3.31 |
| Menominee | 99.4 /100 | #90 | Exceptional 3.30 |
| Immigrants | Pakistan | 99.2 /100 | #91 | Exceptional 3.30 |
| Immigrants | Cameroon | 99.2 /100 | #92 | Exceptional 3.30 |
| Peruvians | 99.2 /100 | #93 | Exceptional 3.30 |
| Sierra Leoneans | 99.0 /100 | #94 | Exceptional 3.30 |
| Immigrants | Lebanon | 99.0 /100 | #95 | Exceptional 3.30 |
| U.S. Virgin Islanders | 98.8 /100 | #96 | Exceptional 3.29 |
| Immigrants | Oceania | 98.7 /100 | #97 | Exceptional 3.29 |
| Barbadians | 98.6 /100 | #98 | Exceptional 3.29 |
| Nigerians | 98.6 /100 | #99 | Exceptional 3.29 |
| Guamanians/Chamorros | 98.6 /100 | #100 | Exceptional 3.29 |