Bhutanese vs Immigrants In Labor Force | Age 16-19
COMPARE
Bhutanese
Immigrants
In Labor Force | Age 16-19
In Labor Force | Age 16-19 Comparison
Bhutanese
Immigrants
36.3%
IN LABOR FORCE | AGE 16-19
35.3/ 100
METRIC RATING
185th/ 347
METRIC RANK
34.6%
IN LABOR FORCE | AGE 16-19
1.2/ 100
METRIC RATING
259th/ 347
METRIC RANK
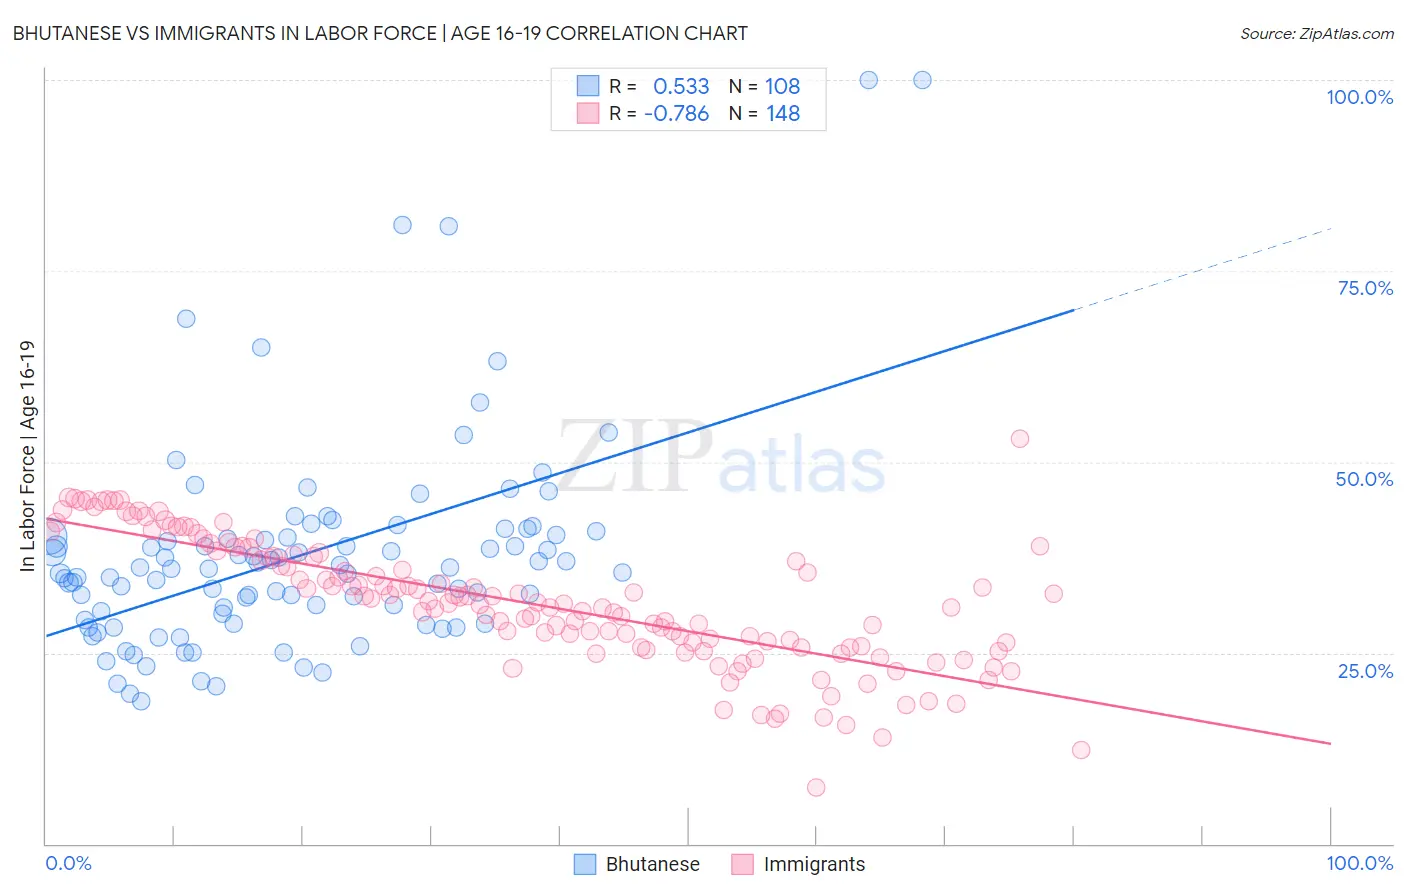
Bhutanese vs Immigrants In Labor Force | Age 16-19 Correlation Chart
The statistical analysis conducted on geographies consisting of 454,665,515 people shows a substantial positive correlation between the proportion of Bhutanese and labor force participation rate among population between the ages 16 and 19 in the United States with a correlation coefficient (R) of 0.533 and weighted average of 36.3%. Similarly, the statistical analysis conducted on geographies consisting of 573,117,494 people shows a strong negative correlation between the proportion of Immigrants and labor force participation rate among population between the ages 16 and 19 in the United States with a correlation coefficient (R) of -0.786 and weighted average of 34.6%, a difference of 5.0%.
In Labor Force | Age 16-19 Correlation Summary
| Measurement | Bhutanese | Immigrants |
| Minimum | 18.6% | 7.3% |
| Maximum | 100.0% | 53.1% |
| Range | 81.4% | 45.8% |
| Mean | 37.8% | 31.5% |
| Median | 36.0% | 31.6% |
| Interquartile 25% (IQ1) | 29.8% | 25.8% |
| Interquartile 75% (IQ3) | 40.4% | 37.7% |
| Interquartile Range (IQR) | 10.6% | 12.0% |
| Standard Deviation (Sample) | 13.9% | 8.3% |
| Standard Deviation (Population) | 13.8% | 8.2% |
Similar Demographics by In Labor Force | Age 16-19
Demographics Similar to Bhutanese by In Labor Force | Age 16-19
In terms of in labor force | age 16-19, the demographic groups most similar to Bhutanese are Costa Rican (36.3%, a difference of 0.040%), Immigrants from Romania (36.3%, a difference of 0.070%), Immigrants from Afghanistan (36.3%, a difference of 0.080%), Eastern European (36.4%, a difference of 0.19%), and Immigrants from Europe (36.2%, a difference of 0.20%).
| Demographics | Rating | Rank | In Labor Force | Age 16-19 |
| Blacks/African Americans | 45.1 /100 | #178 | Average 36.5% |
| Immigrants | Southern Europe | 43.3 /100 | #179 | Average 36.4% |
| Immigrants | Morocco | 41.1 /100 | #180 | Average 36.4% |
| Jordanians | 39.6 /100 | #181 | Fair 36.4% |
| Immigrants | Italy | 39.1 /100 | #182 | Fair 36.4% |
| Eastern Europeans | 38.8 /100 | #183 | Fair 36.4% |
| Costa Ricans | 36.1 /100 | #184 | Fair 36.3% |
| Bhutanese | 35.3 /100 | #185 | Fair 36.3% |
| Immigrants | Romania | 34.0 /100 | #186 | Fair 36.3% |
| Immigrants | Afghanistan | 34.0 /100 | #187 | Fair 36.3% |
| Immigrants | Europe | 31.8 /100 | #188 | Fair 36.2% |
| Immigrants | Hungary | 28.8 /100 | #189 | Fair 36.2% |
| Panamanians | 28.6 /100 | #190 | Fair 36.1% |
| Immigrants | Croatia | 27.5 /100 | #191 | Fair 36.1% |
| Afghans | 25.7 /100 | #192 | Fair 36.1% |
Demographics Similar to Immigrants by In Labor Force | Age 16-19
In terms of in labor force | age 16-19, the demographic groups most similar to Immigrants are Immigrants from Egypt (34.6%, a difference of 0.020%), Thai (34.6%, a difference of 0.020%), Immigrants from South Central Asia (34.6%, a difference of 0.030%), Egyptian (34.5%, a difference of 0.080%), and Salvadoran (34.5%, a difference of 0.12%).
| Demographics | Rating | Rank | In Labor Force | Age 16-19 |
| Immigrants | Chile | 2.0 /100 | #252 | Tragic 34.8% |
| Immigrants | Japan | 1.5 /100 | #253 | Tragic 34.7% |
| Bahamians | 1.4 /100 | #254 | Tragic 34.6% |
| Peruvians | 1.4 /100 | #255 | Tragic 34.6% |
| Immigrants | South Central Asia | 1.3 /100 | #256 | Tragic 34.6% |
| Immigrants | Egypt | 1.2 /100 | #257 | Tragic 34.6% |
| Thais | 1.2 /100 | #258 | Tragic 34.6% |
| Immigrants | Immigrants | 1.2 /100 | #259 | Tragic 34.6% |
| Egyptians | 1.2 /100 | #260 | Tragic 34.5% |
| Salvadorans | 1.1 /100 | #261 | Tragic 34.5% |
| Hispanics or Latinos | 1.1 /100 | #262 | Tragic 34.5% |
| Burmese | 1.1 /100 | #263 | Tragic 34.5% |
| Immigrants | Uruguay | 0.9 /100 | #264 | Tragic 34.4% |
| Immigrants | El Salvador | 0.7 /100 | #265 | Tragic 34.3% |
| Immigrants | Malaysia | 0.7 /100 | #266 | Tragic 34.3% |