Iroquois vs Immigrants Currently Married
COMPARE
Iroquois
Immigrants
Currently Married
Currently Married Comparison
Iroquois
Immigrants
44.7%
CURRENTLY MARRIED
1.1/ 100
METRIC RATING
234th/ 347
METRIC RANK
45.8%
CURRENTLY MARRIED
11.2/ 100
METRIC RATING
206th/ 347
METRIC RANK
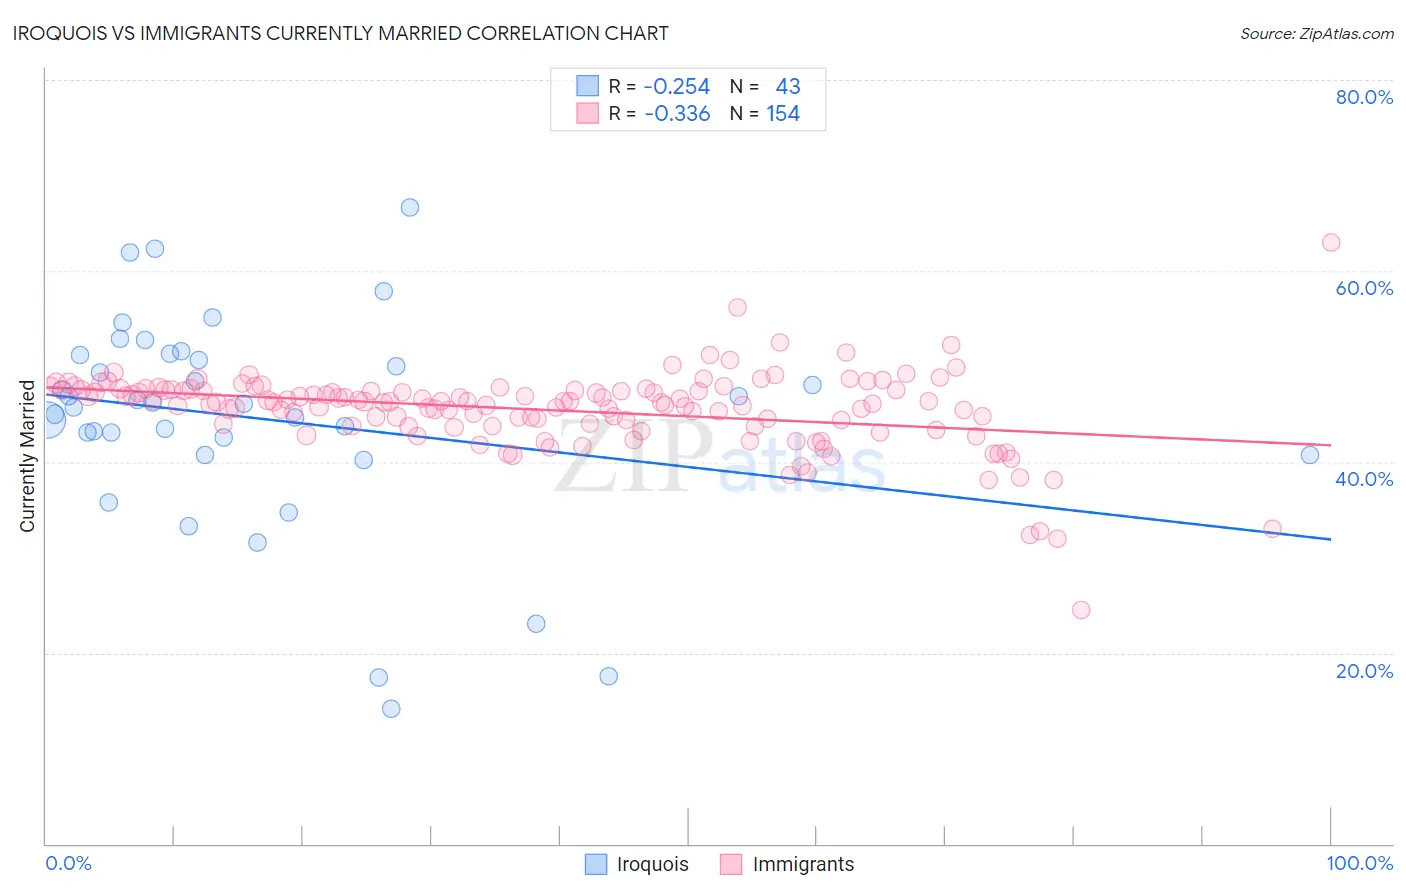
Iroquois vs Immigrants Currently Married Correlation Chart
The statistical analysis conducted on geographies consisting of 207,297,556 people shows a weak negative correlation between the proportion of Iroquois and percentage of population currently married in the United States with a correlation coefficient (R) of -0.254 and weighted average of 44.7%. Similarly, the statistical analysis conducted on geographies consisting of 577,640,121 people shows a mild negative correlation between the proportion of Immigrants and percentage of population currently married in the United States with a correlation coefficient (R) of -0.336 and weighted average of 45.8%, a difference of 2.3%.
Currently Married Correlation Summary
| Measurement | Iroquois | Immigrants |
| Minimum | 14.1% | 24.5% |
| Maximum | 66.7% | 62.9% |
| Range | 52.6% | 38.5% |
| Mean | 44.5% | 45.4% |
| Median | 46.1% | 46.3% |
| Interquartile 25% (IQ1) | 40.7% | 43.8% |
| Interquartile 75% (IQ3) | 51.2% | 47.5% |
| Interquartile Range (IQR) | 10.5% | 3.7% |
| Standard Deviation (Sample) | 11.2% | 4.2% |
| Standard Deviation (Population) | 11.1% | 4.2% |
Similar Demographics by Currently Married
Demographics Similar to Iroquois by Currently Married
In terms of currently married, the demographic groups most similar to Iroquois are Immigrants from Saudi Arabia (44.7%, a difference of 0.010%), Nepalese (44.7%, a difference of 0.060%), Alaskan Athabascan (44.6%, a difference of 0.16%), Cuban (44.6%, a difference of 0.16%), and Seminole (44.6%, a difference of 0.17%).
| Demographics | Rating | Rank | Currently Married |
| Spanish Americans | 2.1 /100 | #227 | Tragic 45.0% |
| Immigrants | Uruguay | 2.0 /100 | #228 | Tragic 45.0% |
| Cree | 1.7 /100 | #229 | Tragic 44.9% |
| Immigrants | Kenya | 1.6 /100 | #230 | Tragic 44.9% |
| Immigrants | Panama | 1.5 /100 | #231 | Tragic 44.9% |
| Nepalese | 1.2 /100 | #232 | Tragic 44.7% |
| Immigrants | Saudi Arabia | 1.1 /100 | #233 | Tragic 44.7% |
| Iroquois | 1.1 /100 | #234 | Tragic 44.7% |
| Alaskan Athabascans | 0.9 /100 | #235 | Tragic 44.6% |
| Cubans | 0.9 /100 | #236 | Tragic 44.6% |
| Seminole | 0.9 /100 | #237 | Tragic 44.6% |
| Moroccans | 0.9 /100 | #238 | Tragic 44.6% |
| Immigrants | Mexico | 0.7 /100 | #239 | Tragic 44.5% |
| Mexican American Indians | 0.7 /100 | #240 | Tragic 44.5% |
| Ethiopians | 0.7 /100 | #241 | Tragic 44.5% |
Demographics Similar to Immigrants by Currently Married
In terms of currently married, the demographic groups most similar to Immigrants are South American Indian (45.8%, a difference of 0.020%), Taiwanese (45.8%, a difference of 0.040%), Immigrants from Spain (45.8%, a difference of 0.040%), Immigrants from South America (45.7%, a difference of 0.040%), and Alsatian (45.7%, a difference of 0.050%).
| Demographics | Rating | Rank | Currently Married |
| Immigrants | Costa Rica | 19.6 /100 | #199 | Poor 46.0% |
| Creek | 17.2 /100 | #200 | Poor 46.0% |
| Malaysians | 15.3 /100 | #201 | Poor 45.9% |
| Immigrants | Albania | 14.5 /100 | #202 | Poor 45.9% |
| Taiwanese | 11.7 /100 | #203 | Poor 45.8% |
| Immigrants | Spain | 11.6 /100 | #204 | Poor 45.8% |
| South American Indians | 11.5 /100 | #205 | Poor 45.8% |
| Immigrants | Immigrants | 11.2 /100 | #206 | Poor 45.8% |
| Immigrants | South America | 10.8 /100 | #207 | Poor 45.7% |
| Alsatians | 10.8 /100 | #208 | Poor 45.7% |
| Immigrants | Micronesia | 8.8 /100 | #209 | Tragic 45.6% |
| Uruguayans | 7.9 /100 | #210 | Tragic 45.6% |
| Houma | 7.2 /100 | #211 | Tragic 45.5% |
| Marshallese | 7.2 /100 | #212 | Tragic 45.5% |
| Alaska Natives | 7.0 /100 | #213 | Tragic 45.5% |