Uruguayan vs Immigrants Currently Married
COMPARE
Uruguayan
Immigrants
Currently Married
Currently Married Comparison
Uruguayans
Immigrants
45.6%
CURRENTLY MARRIED
7.9/ 100
METRIC RATING
210th/ 347
METRIC RANK
45.8%
CURRENTLY MARRIED
11.2/ 100
METRIC RATING
206th/ 347
METRIC RANK
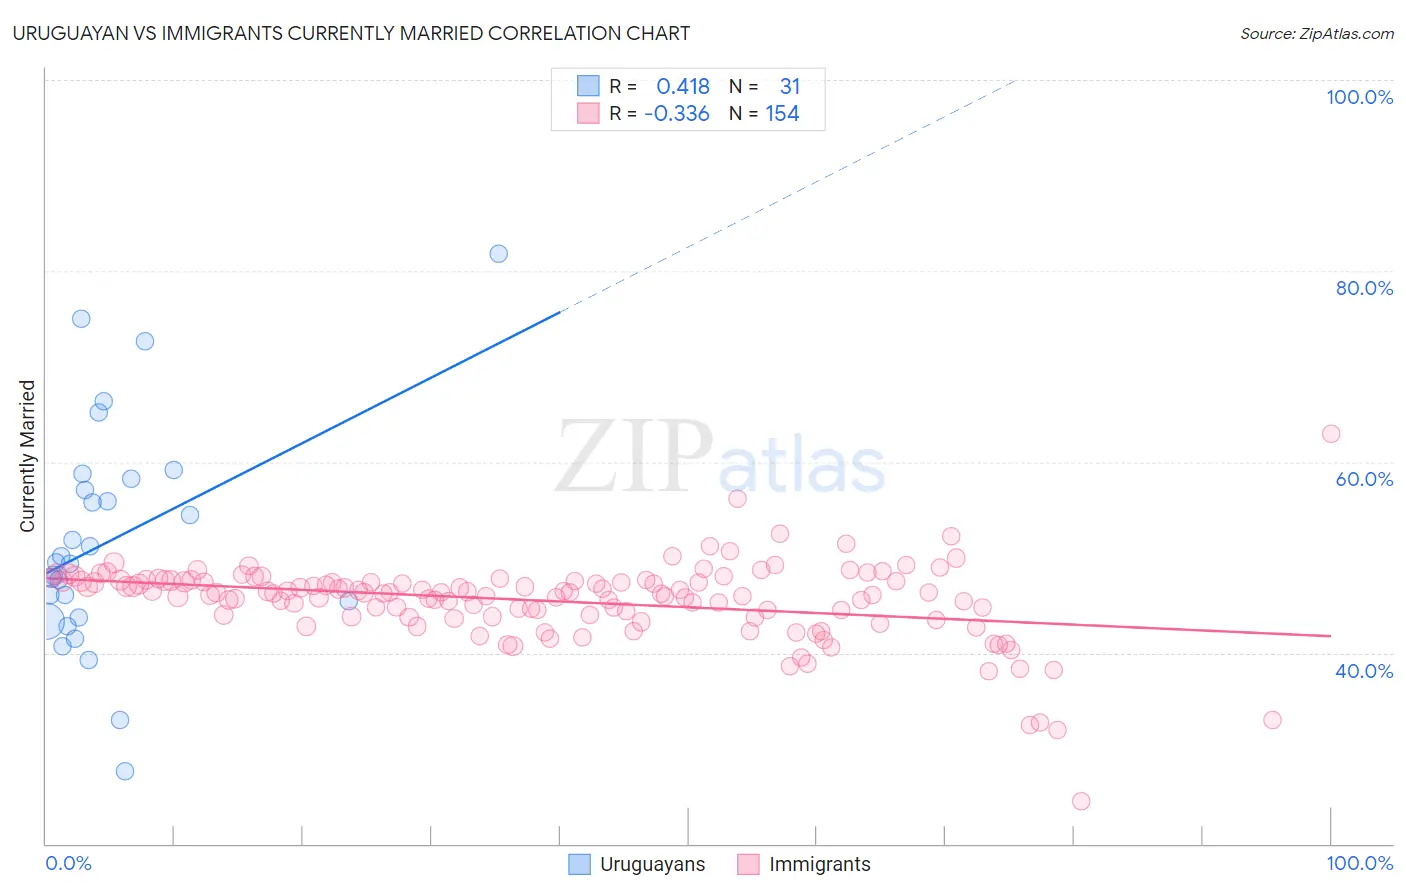
Uruguayan vs Immigrants Currently Married Correlation Chart
The statistical analysis conducted on geographies consisting of 144,776,099 people shows a moderate positive correlation between the proportion of Uruguayans and percentage of population currently married in the United States with a correlation coefficient (R) of 0.418 and weighted average of 45.6%. Similarly, the statistical analysis conducted on geographies consisting of 577,640,121 people shows a mild negative correlation between the proportion of Immigrants and percentage of population currently married in the United States with a correlation coefficient (R) of -0.336 and weighted average of 45.8%, a difference of 0.37%.
Currently Married Correlation Summary
| Measurement | Uruguayan | Immigrants |
| Minimum | 27.6% | 24.5% |
| Maximum | 81.8% | 62.9% |
| Range | 54.2% | 38.5% |
| Mean | 51.8% | 45.4% |
| Median | 49.5% | 46.3% |
| Interquartile 25% (IQ1) | 43.7% | 43.8% |
| Interquartile 75% (IQ3) | 58.2% | 47.5% |
| Interquartile Range (IQR) | 14.6% | 3.7% |
| Standard Deviation (Sample) | 11.8% | 4.2% |
| Standard Deviation (Population) | 11.6% | 4.2% |
Demographics Similar to Uruguayans and Immigrants by Currently Married
In terms of currently married, the demographic groups most similar to Uruguayans are Houma (45.5%, a difference of 0.090%), Marshallese (45.5%, a difference of 0.090%), Immigrants from Micronesia (45.6%, a difference of 0.11%), Alaska Native (45.5%, a difference of 0.12%), and Dutch West Indian (45.5%, a difference of 0.16%). Similarly, the demographic groups most similar to Immigrants are South American Indian (45.8%, a difference of 0.020%), Taiwanese (45.8%, a difference of 0.040%), Immigrants from Spain (45.8%, a difference of 0.040%), Immigrants from South America (45.7%, a difference of 0.040%), and Alsatian (45.7%, a difference of 0.050%).
| Demographics | Rating | Rank | Currently Married |
| Immigrants | Colombia | 21.0 /100 | #198 | Fair 46.1% |
| Immigrants | Costa Rica | 19.6 /100 | #199 | Poor 46.0% |
| Creek | 17.2 /100 | #200 | Poor 46.0% |
| Malaysians | 15.3 /100 | #201 | Poor 45.9% |
| Immigrants | Albania | 14.5 /100 | #202 | Poor 45.9% |
| Taiwanese | 11.7 /100 | #203 | Poor 45.8% |
| Immigrants | Spain | 11.6 /100 | #204 | Poor 45.8% |
| South American Indians | 11.5 /100 | #205 | Poor 45.8% |
| Immigrants | Immigrants | 11.2 /100 | #206 | Poor 45.8% |
| Immigrants | South America | 10.8 /100 | #207 | Poor 45.7% |
| Alsatians | 10.8 /100 | #208 | Poor 45.7% |
| Immigrants | Micronesia | 8.8 /100 | #209 | Tragic 45.6% |
| Uruguayans | 7.9 /100 | #210 | Tragic 45.6% |
| Houma | 7.2 /100 | #211 | Tragic 45.5% |
| Marshallese | 7.2 /100 | #212 | Tragic 45.5% |
| Alaska Natives | 7.0 /100 | #213 | Tragic 45.5% |
| Dutch West Indians | 6.7 /100 | #214 | Tragic 45.5% |
| German Russians | 6.7 /100 | #215 | Tragic 45.5% |
| Immigrants | Morocco | 5.5 /100 | #216 | Tragic 45.4% |
| Immigrants | Thailand | 5.1 /100 | #217 | Tragic 45.4% |
| Panamanians | 4.0 /100 | #218 | Tragic 45.3% |