Immigrants from Bolivia vs Immigrants Currently Married
COMPARE
Immigrants from Bolivia
Immigrants
Currently Married
Currently Married Comparison
Immigrants from Bolivia
Immigrants
47.9%
CURRENTLY MARRIED
95.6/ 100
METRIC RATING
91st/ 347
METRIC RANK
45.8%
CURRENTLY MARRIED
11.2/ 100
METRIC RATING
206th/ 347
METRIC RANK
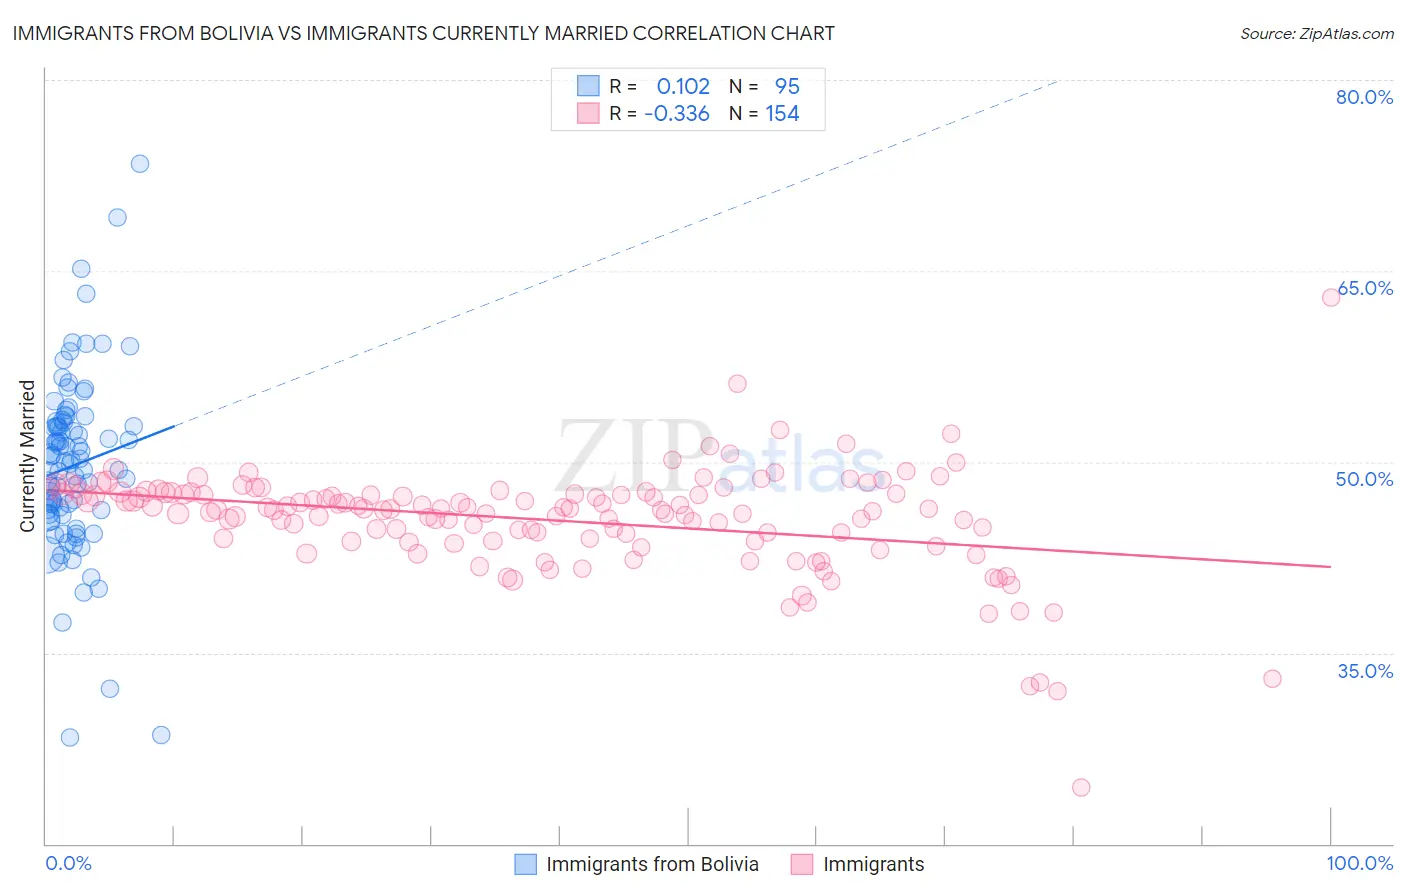
Immigrants from Bolivia vs Immigrants Currently Married Correlation Chart
The statistical analysis conducted on geographies consisting of 158,725,888 people shows a poor positive correlation between the proportion of Immigrants from Bolivia and percentage of population currently married in the United States with a correlation coefficient (R) of 0.102 and weighted average of 47.9%. Similarly, the statistical analysis conducted on geographies consisting of 577,640,121 people shows a mild negative correlation between the proportion of Immigrants and percentage of population currently married in the United States with a correlation coefficient (R) of -0.336 and weighted average of 45.8%, a difference of 4.8%.
Currently Married Correlation Summary
| Measurement | Immigrants from Bolivia | Immigrants |
| Minimum | 28.3% | 24.5% |
| Maximum | 73.4% | 62.9% |
| Range | 45.1% | 38.5% |
| Mean | 49.7% | 45.4% |
| Median | 50.0% | 46.3% |
| Interquartile 25% (IQ1) | 45.9% | 43.8% |
| Interquartile 75% (IQ3) | 53.1% | 47.5% |
| Interquartile Range (IQR) | 7.2% | 3.7% |
| Standard Deviation (Sample) | 7.0% | 4.2% |
| Standard Deviation (Population) | 7.0% | 4.2% |
Similar Demographics by Currently Married
Demographics Similar to Immigrants from Bolivia by Currently Married
In terms of currently married, the demographic groups most similar to Immigrants from Bolivia are American (48.0%, a difference of 0.030%), Korean (47.9%, a difference of 0.040%), Indian (Asian) (48.0%, a difference of 0.050%), Lebanese (47.9%, a difference of 0.090%), and Native Hawaiian (47.9%, a difference of 0.11%).
| Demographics | Rating | Rank | Currently Married |
| Immigrants | Israel | 96.9 /100 | #84 | Exceptional 48.1% |
| French Canadians | 96.3 /100 | #85 | Exceptional 48.0% |
| Immigrants | Japan | 96.2 /100 | #86 | Exceptional 48.0% |
| Jordanians | 96.2 /100 | #87 | Exceptional 48.0% |
| Immigrants | Eastern Europe | 96.1 /100 | #88 | Exceptional 48.0% |
| Indians (Asian) | 95.8 /100 | #89 | Exceptional 48.0% |
| Americans | 95.7 /100 | #90 | Exceptional 48.0% |
| Immigrants | Bolivia | 95.6 /100 | #91 | Exceptional 47.9% |
| Koreans | 95.4 /100 | #92 | Exceptional 47.9% |
| Lebanese | 95.1 /100 | #93 | Exceptional 47.9% |
| Native Hawaiians | 95.0 /100 | #94 | Exceptional 47.9% |
| Immigrants | Bulgaria | 94.8 /100 | #95 | Exceptional 47.9% |
| Egyptians | 94.8 /100 | #96 | Exceptional 47.9% |
| Immigrants | Ukraine | 94.8 /100 | #97 | Exceptional 47.9% |
| Immigrants | China | 94.7 /100 | #98 | Exceptional 47.9% |
Demographics Similar to Immigrants by Currently Married
In terms of currently married, the demographic groups most similar to Immigrants are South American Indian (45.8%, a difference of 0.020%), Taiwanese (45.8%, a difference of 0.040%), Immigrants from Spain (45.8%, a difference of 0.040%), Immigrants from South America (45.7%, a difference of 0.040%), and Alsatian (45.7%, a difference of 0.050%).
| Demographics | Rating | Rank | Currently Married |
| Immigrants | Costa Rica | 19.6 /100 | #199 | Poor 46.0% |
| Creek | 17.2 /100 | #200 | Poor 46.0% |
| Malaysians | 15.3 /100 | #201 | Poor 45.9% |
| Immigrants | Albania | 14.5 /100 | #202 | Poor 45.9% |
| Taiwanese | 11.7 /100 | #203 | Poor 45.8% |
| Immigrants | Spain | 11.6 /100 | #204 | Poor 45.8% |
| South American Indians | 11.5 /100 | #205 | Poor 45.8% |
| Immigrants | Immigrants | 11.2 /100 | #206 | Poor 45.8% |
| Immigrants | South America | 10.8 /100 | #207 | Poor 45.7% |
| Alsatians | 10.8 /100 | #208 | Poor 45.7% |
| Immigrants | Micronesia | 8.8 /100 | #209 | Tragic 45.6% |
| Uruguayans | 7.9 /100 | #210 | Tragic 45.6% |
| Houma | 7.2 /100 | #211 | Tragic 45.5% |
| Marshallese | 7.2 /100 | #212 | Tragic 45.5% |
| Alaska Natives | 7.0 /100 | #213 | Tragic 45.5% |