Austrian vs South African Average Family Size
COMPARE
Austrian
South African
Average Family Size
Average Family Size Comparison
Austrians
South Africans
3.14
AVERAGE FAMILY SIZE
0.2/ 100
METRIC RATING
295th/ 347
METRIC RANK
3.17
AVERAGE FAMILY SIZE
1.7/ 100
METRIC RATING
253rd/ 347
METRIC RANK
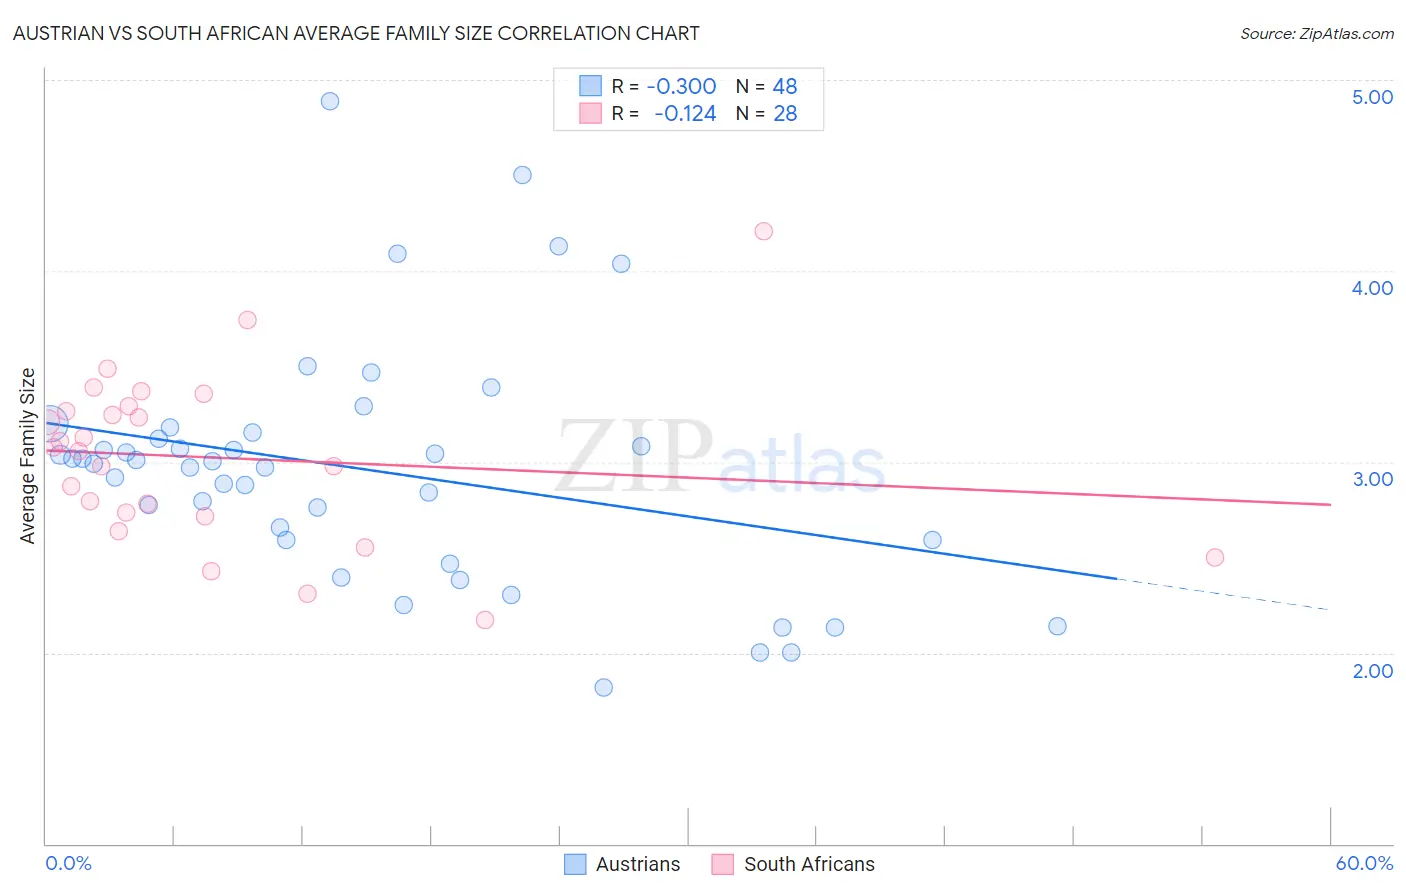
Austrian vs South African Average Family Size Correlation Chart
The statistical analysis conducted on geographies consisting of 451,810,696 people shows a mild negative correlation between the proportion of Austrians and average family size in the United States with a correlation coefficient (R) of -0.300 and weighted average of 3.14. Similarly, the statistical analysis conducted on geographies consisting of 182,542,569 people shows a poor negative correlation between the proportion of South Africans and average family size in the United States with a correlation coefficient (R) of -0.124 and weighted average of 3.17, a difference of 0.96%.
Average Family Size Correlation Summary
| Measurement | Austrian | South African |
| Minimum | 1.82 | 2.17 |
| Maximum | 4.89 | 4.21 |
| Range | 3.07 | 2.04 |
| Mean | 2.96 | 3.02 |
| Median | 3.00 | 3.07 |
| Interquartile 25% (IQ1) | 2.59 | 2.72 |
| Interquartile 75% (IQ3) | 3.14 | 3.28 |
| Interquartile Range (IQR) | 0.55 | 0.56 |
| Standard Deviation (Sample) | 0.63 | 0.44 |
| Standard Deviation (Population) | 0.62 | 0.44 |
Similar Demographics by Average Family Size
Demographics Similar to Austrians by Average Family Size
In terms of average family size, the demographic groups most similar to Austrians are Ukrainian (3.14, a difference of 0.0%), Immigrants from Western Europe (3.14, a difference of 0.0%), Immigrants from Croatia (3.14, a difference of 0.010%), Colville (3.14, a difference of 0.010%), and European (3.14, a difference of 0.030%).
| Demographics | Rating | Rank | Average Family Size |
| Immigrants | Czechoslovakia | 0.3 /100 | #288 | Tragic 3.14 |
| Immigrants | Norway | 0.3 /100 | #289 | Tragic 3.14 |
| Cypriots | 0.3 /100 | #290 | Tragic 3.14 |
| Alsatians | 0.2 /100 | #291 | Tragic 3.14 |
| Europeans | 0.2 /100 | #292 | Tragic 3.14 |
| Scandinavians | 0.2 /100 | #293 | Tragic 3.14 |
| Immigrants | Croatia | 0.2 /100 | #294 | Tragic 3.14 |
| Austrians | 0.2 /100 | #295 | Tragic 3.14 |
| Ukrainians | 0.2 /100 | #296 | Tragic 3.14 |
| Immigrants | Western Europe | 0.2 /100 | #297 | Tragic 3.14 |
| Colville | 0.2 /100 | #298 | Tragic 3.14 |
| Canadians | 0.2 /100 | #299 | Tragic 3.14 |
| Immigrants | Sweden | 0.2 /100 | #300 | Tragic 3.14 |
| Macedonians | 0.2 /100 | #301 | Tragic 3.13 |
| Immigrants | Latvia | 0.2 /100 | #302 | Tragic 3.13 |
Demographics Similar to South Africans by Average Family Size
In terms of average family size, the demographic groups most similar to South Africans are Immigrants from Saudi Arabia (3.17, a difference of 0.0%), Immigrants from Hungary (3.17, a difference of 0.0%), Cape Verdean (3.17, a difference of 0.020%), Immigrants from Spain (3.17, a difference of 0.030%), and Puget Sound Salish (3.17, a difference of 0.040%).
| Demographics | Rating | Rank | Average Family Size |
| Danes | 2.5 /100 | #246 | Tragic 3.17 |
| Cajuns | 2.4 /100 | #247 | Tragic 3.17 |
| Immigrants | Belarus | 2.3 /100 | #248 | Tragic 3.17 |
| Immigrants | Eastern Europe | 2.1 /100 | #249 | Tragic 3.17 |
| Puget Sound Salish | 1.9 /100 | #250 | Tragic 3.17 |
| Immigrants | Spain | 1.8 /100 | #251 | Tragic 3.17 |
| Immigrants | Saudi Arabia | 1.7 /100 | #252 | Tragic 3.17 |
| South Africans | 1.7 /100 | #253 | Tragic 3.17 |
| Immigrants | Hungary | 1.7 /100 | #254 | Tragic 3.17 |
| Cape Verdeans | 1.6 /100 | #255 | Tragic 3.17 |
| Immigrants | Kazakhstan | 1.5 /100 | #256 | Tragic 3.17 |
| Albanians | 1.5 /100 | #257 | Tragic 3.17 |
| Turks | 1.3 /100 | #258 | Tragic 3.16 |
| Potawatomi | 1.3 /100 | #259 | Tragic 3.16 |
| Immigrants | Albania | 1.3 /100 | #260 | Tragic 3.16 |