Immigrants from Romania vs South African Average Family Size
COMPARE
Immigrants from Romania
South African
Average Family Size
Average Family Size Comparison
Immigrants from Romania
South Africans
3.18
AVERAGE FAMILY SIZE
3.7/ 100
METRIC RATING
237th/ 347
METRIC RANK
3.17
AVERAGE FAMILY SIZE
1.7/ 100
METRIC RATING
253rd/ 347
METRIC RANK
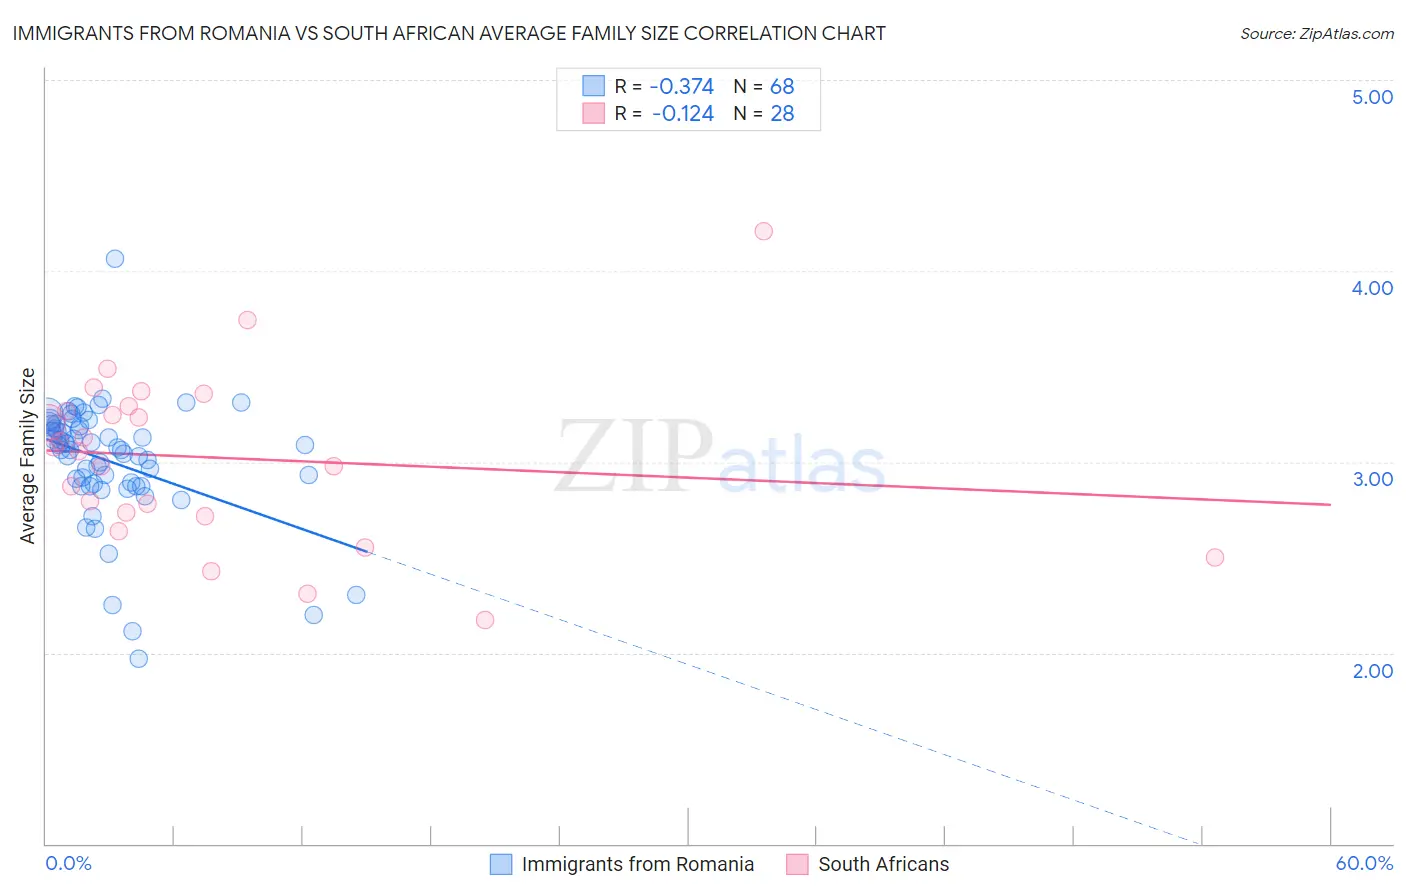
Immigrants from Romania vs South African Average Family Size Correlation Chart
The statistical analysis conducted on geographies consisting of 256,963,542 people shows a mild negative correlation between the proportion of Immigrants from Romania and average family size in the United States with a correlation coefficient (R) of -0.374 and weighted average of 3.18. Similarly, the statistical analysis conducted on geographies consisting of 182,542,569 people shows a poor negative correlation between the proportion of South Africans and average family size in the United States with a correlation coefficient (R) of -0.124 and weighted average of 3.17, a difference of 0.38%.
Average Family Size Correlation Summary
| Measurement | Immigrants from Romania | South African |
| Minimum | 1.97 | 2.17 |
| Maximum | 4.06 | 4.21 |
| Range | 2.09 | 2.04 |
| Mean | 3.00 | 3.02 |
| Median | 3.07 | 3.07 |
| Interquartile 25% (IQ1) | 2.88 | 2.72 |
| Interquartile 75% (IQ3) | 3.19 | 3.28 |
| Interquartile Range (IQR) | 0.31 | 0.56 |
| Standard Deviation (Sample) | 0.32 | 0.44 |
| Standard Deviation (Population) | 0.32 | 0.44 |
Demographics Similar to Immigrants from Romania and South Africans by Average Family Size
In terms of average family size, the demographic groups most similar to Immigrants from Romania are Romanian (3.18, a difference of 0.0%), Immigrants from Portugal (3.18, a difference of 0.050%), Houma (3.18, a difference of 0.050%), Immigrants from Turkey (3.18, a difference of 0.060%), and Osage (3.18, a difference of 0.070%). Similarly, the demographic groups most similar to South Africans are Immigrants from Saudi Arabia (3.17, a difference of 0.0%), Immigrants from Hungary (3.17, a difference of 0.0%), Cape Verdean (3.17, a difference of 0.020%), Immigrants from Spain (3.17, a difference of 0.030%), and Puget Sound Salish (3.17, a difference of 0.040%).
| Demographics | Rating | Rank | Average Family Size |
| Immigrants | Turkey | 4.2 /100 | #235 | Tragic 3.18 |
| Immigrants | Portugal | 4.2 /100 | #236 | Tragic 3.18 |
| Immigrants | Romania | 3.7 /100 | #237 | Tragic 3.18 |
| Romanians | 3.7 /100 | #238 | Tragic 3.18 |
| Houma | 3.4 /100 | #239 | Tragic 3.18 |
| Osage | 3.2 /100 | #240 | Tragic 3.18 |
| Immigrants | Japan | 3.0 /100 | #241 | Tragic 3.18 |
| Hungarians | 3.0 /100 | #242 | Tragic 3.18 |
| Immigrants | Moldova | 2.9 /100 | #243 | Tragic 3.18 |
| Immigrants | Southern Europe | 2.9 /100 | #244 | Tragic 3.18 |
| Immigrants | Brazil | 2.7 /100 | #245 | Tragic 3.18 |
| Danes | 2.5 /100 | #246 | Tragic 3.17 |
| Cajuns | 2.4 /100 | #247 | Tragic 3.17 |
| Immigrants | Belarus | 2.3 /100 | #248 | Tragic 3.17 |
| Immigrants | Eastern Europe | 2.1 /100 | #249 | Tragic 3.17 |
| Puget Sound Salish | 1.9 /100 | #250 | Tragic 3.17 |
| Immigrants | Spain | 1.8 /100 | #251 | Tragic 3.17 |
| Immigrants | Saudi Arabia | 1.7 /100 | #252 | Tragic 3.17 |
| South Africans | 1.7 /100 | #253 | Tragic 3.17 |
| Immigrants | Hungary | 1.7 /100 | #254 | Tragic 3.17 |
| Cape Verdeans | 1.6 /100 | #255 | Tragic 3.17 |