Argentinean vs South African Average Family Size
COMPARE
Argentinean
South African
Average Family Size
Average Family Size Comparison
Argentineans
South Africans
3.23
AVERAGE FAMILY SIZE
47.4/ 100
METRIC RATING
177th/ 347
METRIC RANK
3.17
AVERAGE FAMILY SIZE
1.7/ 100
METRIC RATING
253rd/ 347
METRIC RANK
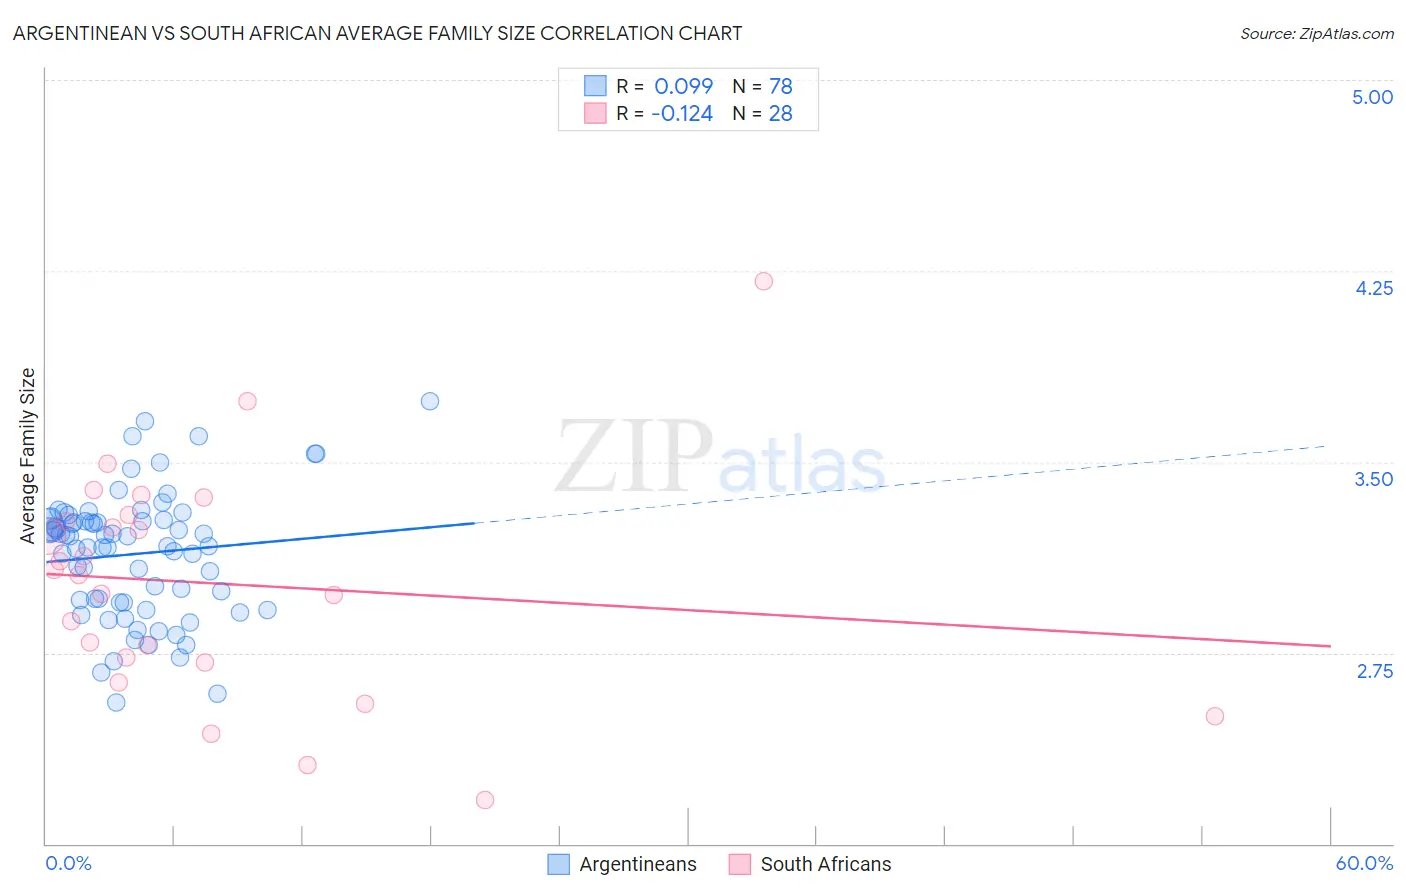
Argentinean vs South African Average Family Size Correlation Chart
The statistical analysis conducted on geographies consisting of 296,996,433 people shows a slight positive correlation between the proportion of Argentineans and average family size in the United States with a correlation coefficient (R) of 0.099 and weighted average of 3.23. Similarly, the statistical analysis conducted on geographies consisting of 182,542,569 people shows a poor negative correlation between the proportion of South Africans and average family size in the United States with a correlation coefficient (R) of -0.124 and weighted average of 3.17, a difference of 1.8%.
Average Family Size Correlation Summary
| Measurement | Argentinean | South African |
| Minimum | 2.56 | 2.17 |
| Maximum | 3.74 | 4.21 |
| Range | 1.18 | 2.04 |
| Mean | 3.14 | 3.02 |
| Median | 3.19 | 3.07 |
| Interquartile 25% (IQ1) | 2.95 | 2.72 |
| Interquartile 75% (IQ3) | 3.27 | 3.28 |
| Interquartile Range (IQR) | 0.32 | 0.56 |
| Standard Deviation (Sample) | 0.25 | 0.44 |
| Standard Deviation (Population) | 0.25 | 0.44 |
Similar Demographics by Average Family Size
Demographics Similar to Argentineans by Average Family Size
In terms of average family size, the demographic groups most similar to Argentineans are Spaniard (3.23, a difference of 0.0%), Immigrants from Korea (3.23, a difference of 0.010%), Palestinian (3.23, a difference of 0.010%), Israeli (3.23, a difference of 0.020%), and Immigrants from South Central Asia (3.23, a difference of 0.050%).
| Demographics | Rating | Rank | Average Family Size |
| Arabs | 53.8 /100 | #170 | Average 3.23 |
| Chileans | 53.2 /100 | #171 | Average 3.23 |
| Immigrants | Congo | 52.7 /100 | #172 | Average 3.23 |
| Immigrants | Uruguay | 52.0 /100 | #173 | Average 3.23 |
| Immigrants | South Central Asia | 50.0 /100 | #174 | Average 3.23 |
| Immigrants | China | 49.9 /100 | #175 | Average 3.23 |
| Israelis | 48.7 /100 | #176 | Average 3.23 |
| Argentineans | 47.4 /100 | #177 | Average 3.23 |
| Spaniards | 47.2 /100 | #178 | Average 3.23 |
| Immigrants | Korea | 46.9 /100 | #179 | Average 3.23 |
| Palestinians | 46.6 /100 | #180 | Average 3.23 |
| Spanish | 44.8 /100 | #181 | Average 3.23 |
| Moroccans | 44.2 /100 | #182 | Average 3.22 |
| Immigrants | Northern Africa | 41.7 /100 | #183 | Average 3.22 |
| Immigrants | Eastern Asia | 40.8 /100 | #184 | Average 3.22 |
Demographics Similar to South Africans by Average Family Size
In terms of average family size, the demographic groups most similar to South Africans are Immigrants from Saudi Arabia (3.17, a difference of 0.0%), Immigrants from Hungary (3.17, a difference of 0.0%), Cape Verdean (3.17, a difference of 0.020%), Immigrants from Spain (3.17, a difference of 0.030%), and Puget Sound Salish (3.17, a difference of 0.040%).
| Demographics | Rating | Rank | Average Family Size |
| Danes | 2.5 /100 | #246 | Tragic 3.17 |
| Cajuns | 2.4 /100 | #247 | Tragic 3.17 |
| Immigrants | Belarus | 2.3 /100 | #248 | Tragic 3.17 |
| Immigrants | Eastern Europe | 2.1 /100 | #249 | Tragic 3.17 |
| Puget Sound Salish | 1.9 /100 | #250 | Tragic 3.17 |
| Immigrants | Spain | 1.8 /100 | #251 | Tragic 3.17 |
| Immigrants | Saudi Arabia | 1.7 /100 | #252 | Tragic 3.17 |
| South Africans | 1.7 /100 | #253 | Tragic 3.17 |
| Immigrants | Hungary | 1.7 /100 | #254 | Tragic 3.17 |
| Cape Verdeans | 1.6 /100 | #255 | Tragic 3.17 |
| Immigrants | Kazakhstan | 1.5 /100 | #256 | Tragic 3.17 |
| Albanians | 1.5 /100 | #257 | Tragic 3.17 |
| Turks | 1.3 /100 | #258 | Tragic 3.16 |
| Potawatomi | 1.3 /100 | #259 | Tragic 3.16 |
| Immigrants | Albania | 1.3 /100 | #260 | Tragic 3.16 |