Austrian vs Ottawa Average Family Size
COMPARE
Austrian
Ottawa
Average Family Size
Average Family Size Comparison
Austrians
Ottawa
3.14
AVERAGE FAMILY SIZE
0.2/ 100
METRIC RATING
295th/ 347
METRIC RANK
3.11
AVERAGE FAMILY SIZE
0.0/ 100
METRIC RATING
326th/ 347
METRIC RANK
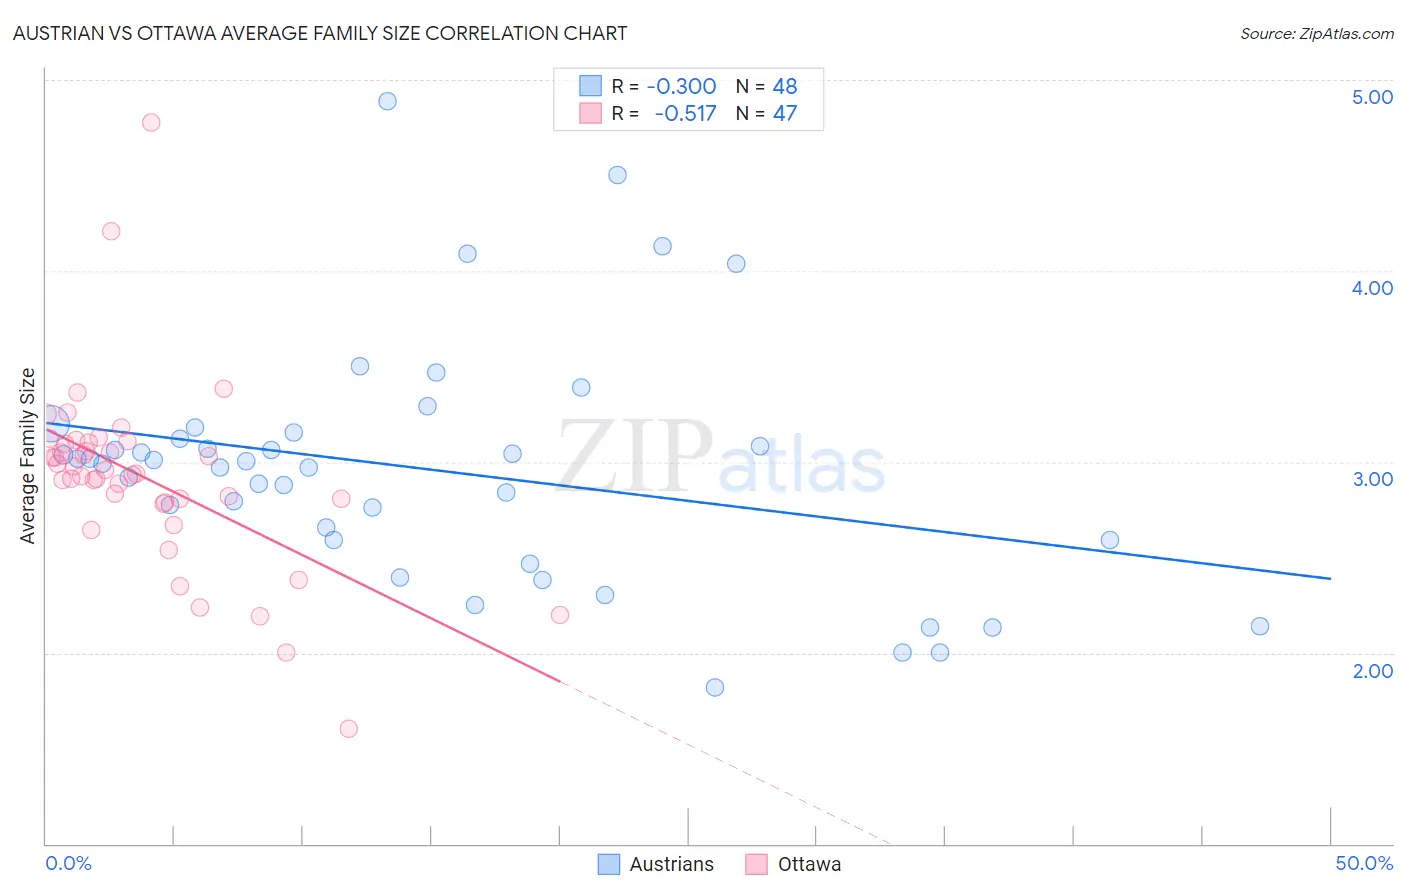
Austrian vs Ottawa Average Family Size Correlation Chart
The statistical analysis conducted on geographies consisting of 451,810,696 people shows a mild negative correlation between the proportion of Austrians and average family size in the United States with a correlation coefficient (R) of -0.300 and weighted average of 3.14. Similarly, the statistical analysis conducted on geographies consisting of 49,944,420 people shows a substantial negative correlation between the proportion of Ottawa and average family size in the United States with a correlation coefficient (R) of -0.517 and weighted average of 3.11, a difference of 0.94%.
Average Family Size Correlation Summary
| Measurement | Austrian | Ottawa |
| Minimum | 1.82 | 1.60 |
| Maximum | 4.89 | 4.78 |
| Range | 3.07 | 3.18 |
| Mean | 2.96 | 2.92 |
| Median | 3.00 | 2.94 |
| Interquartile 25% (IQ1) | 2.59 | 2.79 |
| Interquartile 75% (IQ3) | 3.14 | 3.10 |
| Interquartile Range (IQR) | 0.55 | 0.31 |
| Standard Deviation (Sample) | 0.63 | 0.49 |
| Standard Deviation (Population) | 0.62 | 0.49 |
Similar Demographics by Average Family Size
Demographics Similar to Austrians by Average Family Size
In terms of average family size, the demographic groups most similar to Austrians are Ukrainian (3.14, a difference of 0.0%), Immigrants from Western Europe (3.14, a difference of 0.0%), Immigrants from Croatia (3.14, a difference of 0.010%), Colville (3.14, a difference of 0.010%), and European (3.14, a difference of 0.030%).
| Demographics | Rating | Rank | Average Family Size |
| Immigrants | Czechoslovakia | 0.3 /100 | #288 | Tragic 3.14 |
| Immigrants | Norway | 0.3 /100 | #289 | Tragic 3.14 |
| Cypriots | 0.3 /100 | #290 | Tragic 3.14 |
| Alsatians | 0.2 /100 | #291 | Tragic 3.14 |
| Europeans | 0.2 /100 | #292 | Tragic 3.14 |
| Scandinavians | 0.2 /100 | #293 | Tragic 3.14 |
| Immigrants | Croatia | 0.2 /100 | #294 | Tragic 3.14 |
| Austrians | 0.2 /100 | #295 | Tragic 3.14 |
| Ukrainians | 0.2 /100 | #296 | Tragic 3.14 |
| Immigrants | Western Europe | 0.2 /100 | #297 | Tragic 3.14 |
| Colville | 0.2 /100 | #298 | Tragic 3.14 |
| Canadians | 0.2 /100 | #299 | Tragic 3.14 |
| Immigrants | Sweden | 0.2 /100 | #300 | Tragic 3.14 |
| Macedonians | 0.2 /100 | #301 | Tragic 3.13 |
| Immigrants | Latvia | 0.2 /100 | #302 | Tragic 3.13 |
Demographics Similar to Ottawa by Average Family Size
In terms of average family size, the demographic groups most similar to Ottawa are Dutch (3.11, a difference of 0.010%), Czech (3.11, a difference of 0.010%), English (3.11, a difference of 0.050%), Belgian (3.11, a difference of 0.070%), and Celtic (3.11, a difference of 0.090%).
| Demographics | Rating | Rank | Average Family Size |
| Welsh | 0.1 /100 | #319 | Tragic 3.12 |
| Immigrants | North America | 0.0 /100 | #320 | Tragic 3.12 |
| Immigrants | Austria | 0.0 /100 | #321 | Tragic 3.12 |
| Immigrants | Canada | 0.0 /100 | #322 | Tragic 3.12 |
| Soviet Union | 0.0 /100 | #323 | Tragic 3.11 |
| Celtics | 0.0 /100 | #324 | Tragic 3.11 |
| English | 0.0 /100 | #325 | Tragic 3.11 |
| Ottawa | 0.0 /100 | #326 | Tragic 3.11 |
| Dutch | 0.0 /100 | #327 | Tragic 3.11 |
| Czechs | 0.0 /100 | #328 | Tragic 3.11 |
| Belgians | 0.0 /100 | #329 | Tragic 3.11 |
| Latvians | 0.0 /100 | #330 | Tragic 3.11 |
| Scotch-Irish | 0.0 /100 | #331 | Tragic 3.11 |
| Scottish | 0.0 /100 | #332 | Tragic 3.11 |
| Estonians | 0.0 /100 | #333 | Tragic 3.10 |