Austrian vs Immigrants from Ghana Average Family Size
COMPARE
Austrian
Immigrants from Ghana
Average Family Size
Average Family Size Comparison
Austrians
Immigrants from Ghana
3.14
AVERAGE FAMILY SIZE
0.2/ 100
METRIC RATING
295th/ 347
METRIC RANK
3.29
AVERAGE FAMILY SIZE
98.1/ 100
METRIC RATING
105th/ 347
METRIC RANK
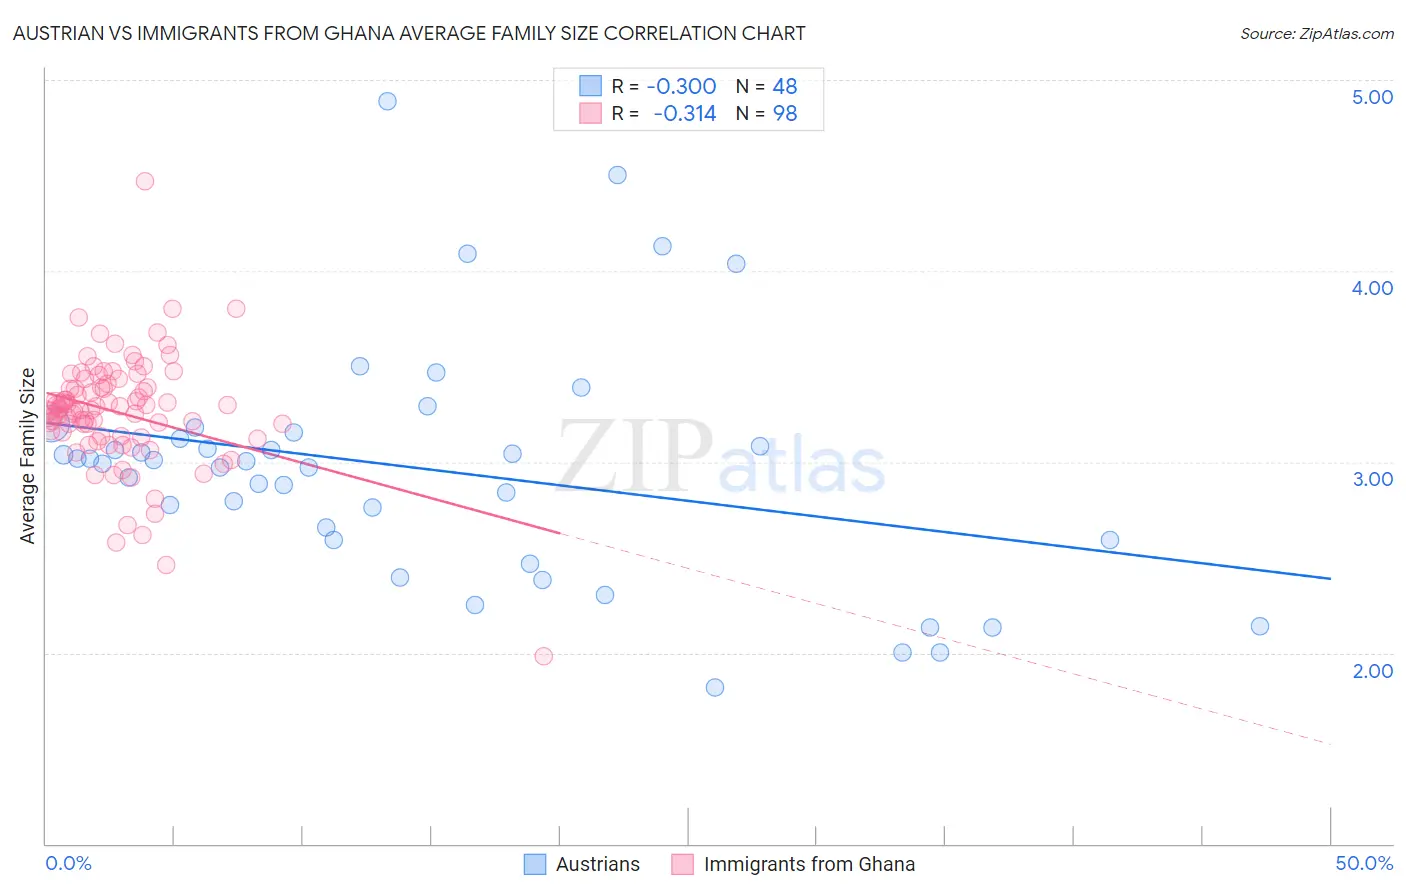
Austrian vs Immigrants from Ghana Average Family Size Correlation Chart
The statistical analysis conducted on geographies consisting of 451,810,696 people shows a mild negative correlation between the proportion of Austrians and average family size in the United States with a correlation coefficient (R) of -0.300 and weighted average of 3.14. Similarly, the statistical analysis conducted on geographies consisting of 199,809,831 people shows a mild negative correlation between the proportion of Immigrants from Ghana and average family size in the United States with a correlation coefficient (R) of -0.314 and weighted average of 3.29, a difference of 4.7%.
Average Family Size Correlation Summary
| Measurement | Austrian | Immigrants from Ghana |
| Minimum | 1.82 | 1.98 |
| Maximum | 4.89 | 4.47 |
| Range | 3.07 | 2.49 |
| Mean | 2.96 | 3.26 |
| Median | 3.00 | 3.27 |
| Interquartile 25% (IQ1) | 2.59 | 3.14 |
| Interquartile 75% (IQ3) | 3.14 | 3.39 |
| Interquartile Range (IQR) | 0.55 | 0.25 |
| Standard Deviation (Sample) | 0.63 | 0.30 |
| Standard Deviation (Population) | 0.62 | 0.30 |
Similar Demographics by Average Family Size
Demographics Similar to Austrians by Average Family Size
In terms of average family size, the demographic groups most similar to Austrians are Ukrainian (3.14, a difference of 0.0%), Immigrants from Western Europe (3.14, a difference of 0.0%), Immigrants from Croatia (3.14, a difference of 0.010%), Colville (3.14, a difference of 0.010%), and European (3.14, a difference of 0.030%).
| Demographics | Rating | Rank | Average Family Size |
| Immigrants | Czechoslovakia | 0.3 /100 | #288 | Tragic 3.14 |
| Immigrants | Norway | 0.3 /100 | #289 | Tragic 3.14 |
| Cypriots | 0.3 /100 | #290 | Tragic 3.14 |
| Alsatians | 0.2 /100 | #291 | Tragic 3.14 |
| Europeans | 0.2 /100 | #292 | Tragic 3.14 |
| Scandinavians | 0.2 /100 | #293 | Tragic 3.14 |
| Immigrants | Croatia | 0.2 /100 | #294 | Tragic 3.14 |
| Austrians | 0.2 /100 | #295 | Tragic 3.14 |
| Ukrainians | 0.2 /100 | #296 | Tragic 3.14 |
| Immigrants | Western Europe | 0.2 /100 | #297 | Tragic 3.14 |
| Colville | 0.2 /100 | #298 | Tragic 3.14 |
| Canadians | 0.2 /100 | #299 | Tragic 3.14 |
| Immigrants | Sweden | 0.2 /100 | #300 | Tragic 3.14 |
| Macedonians | 0.2 /100 | #301 | Tragic 3.13 |
| Immigrants | Latvia | 0.2 /100 | #302 | Tragic 3.13 |
Demographics Similar to Immigrants from Ghana by Average Family Size
In terms of average family size, the demographic groups most similar to Immigrants from Ghana are Paiute (3.29, a difference of 0.020%), Ghanaian (3.29, a difference of 0.030%), Bolivian (3.29, a difference of 0.050%), Immigrants from Western Africa (3.29, a difference of 0.090%), and West Indian (3.29, a difference of 0.12%).
| Demographics | Rating | Rank | Average Family Size |
| Barbadians | 98.6 /100 | #98 | Exceptional 3.29 |
| Nigerians | 98.6 /100 | #99 | Exceptional 3.29 |
| Guamanians/Chamorros | 98.6 /100 | #100 | Exceptional 3.29 |
| Immigrants | Burma/Myanmar | 98.6 /100 | #101 | Exceptional 3.29 |
| West Indians | 98.5 /100 | #102 | Exceptional 3.29 |
| Immigrants | Western Africa | 98.4 /100 | #103 | Exceptional 3.29 |
| Bolivians | 98.3 /100 | #104 | Exceptional 3.29 |
| Immigrants | Ghana | 98.1 /100 | #105 | Exceptional 3.29 |
| Paiute | 98.0 /100 | #106 | Exceptional 3.29 |
| Ghanaians | 98.0 /100 | #107 | Exceptional 3.29 |
| Asians | 97.0 /100 | #108 | Exceptional 3.28 |
| Puerto Ricans | 96.7 /100 | #109 | Exceptional 3.28 |
| Bahamians | 96.6 /100 | #110 | Exceptional 3.28 |
| Indonesians | 96.2 /100 | #111 | Exceptional 3.28 |
| Blacks/African Americans | 95.7 /100 | #112 | Exceptional 3.27 |