Austrian vs South African Female Unemployment
COMPARE
Austrian
South African
Female Unemployment
Female Unemployment Comparison
Austrians
South Africans
4.9%
FEMALE UNEMPLOYMENT
99.3/ 100
METRIC RATING
45th/ 347
METRIC RANK
5.2%
FEMALE UNEMPLOYMENT
70.8/ 100
METRIC RATING
154th/ 347
METRIC RANK
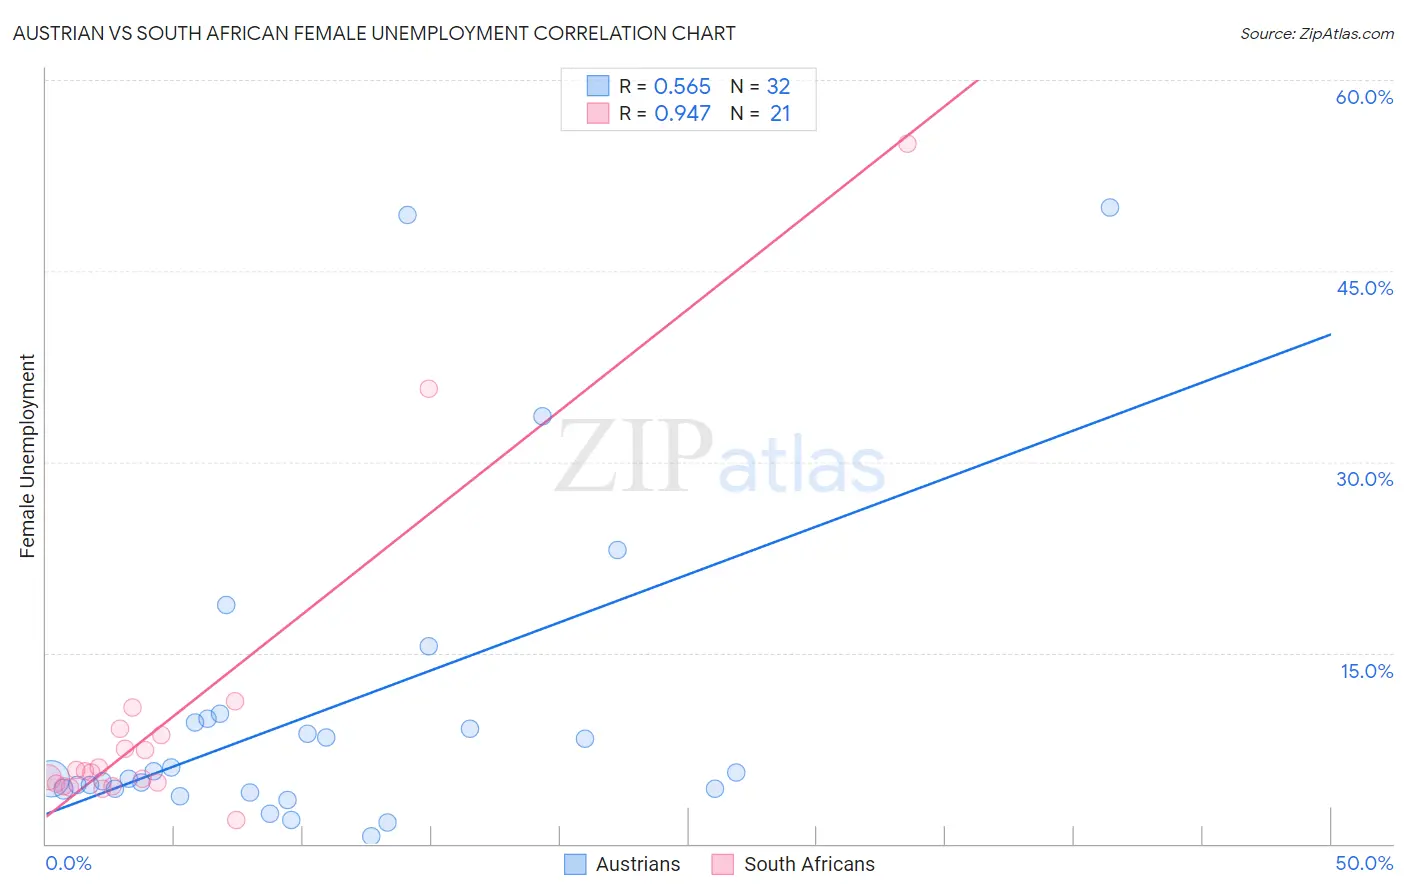
Austrian vs South African Female Unemployment Correlation Chart
The statistical analysis conducted on geographies consisting of 448,029,522 people shows a substantial positive correlation between the proportion of Austrians and unemploymnet rate among females in the United States with a correlation coefficient (R) of 0.565 and weighted average of 4.9%. Similarly, the statistical analysis conducted on geographies consisting of 182,288,157 people shows a near-perfect positive correlation between the proportion of South Africans and unemploymnet rate among females in the United States with a correlation coefficient (R) of 0.947 and weighted average of 5.2%, a difference of 6.7%.
Female Unemployment Correlation Summary
| Measurement | Austrian | South African |
| Minimum | 0.60% | 1.9% |
| Maximum | 50.0% | 55.0% |
| Range | 49.4% | 53.1% |
| Mean | 10.4% | 9.9% |
| Median | 5.4% | 5.7% |
| Interquartile 25% (IQ1) | 4.3% | 4.6% |
| Interquartile 75% (IQ3) | 9.7% | 8.8% |
| Interquartile Range (IQR) | 5.4% | 4.2% |
| Standard Deviation (Sample) | 12.3% | 12.4% |
| Standard Deviation (Population) | 12.1% | 12.1% |
Similar Demographics by Female Unemployment
Demographics Similar to Austrians by Female Unemployment
In terms of female unemployment, the demographic groups most similar to Austrians are Immigrants from Bulgaria (4.9%, a difference of 0.030%), Greek (4.9%, a difference of 0.080%), Okinawan (4.9%, a difference of 0.11%), Eastern European (4.9%, a difference of 0.18%), and Thai (4.9%, a difference of 0.31%).
| Demographics | Rating | Rank | Female Unemployment |
| Northern Europeans | 99.6 /100 | #38 | Exceptional 4.8% |
| Scotch-Irish | 99.6 /100 | #39 | Exceptional 4.8% |
| French | 99.6 /100 | #40 | Exceptional 4.8% |
| Tongans | 99.5 /100 | #41 | Exceptional 4.8% |
| Italians | 99.5 /100 | #42 | Exceptional 4.8% |
| Eastern Europeans | 99.4 /100 | #43 | Exceptional 4.9% |
| Greeks | 99.4 /100 | #44 | Exceptional 4.9% |
| Austrians | 99.3 /100 | #45 | Exceptional 4.9% |
| Immigrants | Bulgaria | 99.3 /100 | #46 | Exceptional 4.9% |
| Okinawans | 99.3 /100 | #47 | Exceptional 4.9% |
| Thais | 99.2 /100 | #48 | Exceptional 4.9% |
| Australians | 99.2 /100 | #49 | Exceptional 4.9% |
| Immigrants | Cuba | 99.1 /100 | #50 | Exceptional 4.9% |
| Cambodians | 99.1 /100 | #51 | Exceptional 4.9% |
| Slavs | 99.1 /100 | #52 | Exceptional 4.9% |
Demographics Similar to South Africans by Female Unemployment
In terms of female unemployment, the demographic groups most similar to South Africans are Immigrants from Egypt (5.2%, a difference of 0.060%), Immigrants from Northern Africa (5.2%, a difference of 0.080%), Immigrants from Russia (5.2%, a difference of 0.10%), Albanian (5.2%, a difference of 0.18%), and Immigrants from Micronesia (5.2%, a difference of 0.27%).
| Demographics | Rating | Rank | Female Unemployment |
| Argentineans | 79.2 /100 | #147 | Good 5.2% |
| Immigrants | Argentina | 78.7 /100 | #148 | Good 5.2% |
| Asians | 78.3 /100 | #149 | Good 5.2% |
| Egyptians | 78.3 /100 | #150 | Good 5.2% |
| Immigrants | China | 75.9 /100 | #151 | Good 5.2% |
| Immigrants | Italy | 75.0 /100 | #152 | Good 5.2% |
| Immigrants | Greece | 74.9 /100 | #153 | Good 5.2% |
| South Africans | 70.8 /100 | #154 | Good 5.2% |
| Immigrants | Egypt | 70.0 /100 | #155 | Good 5.2% |
| Immigrants | Northern Africa | 69.6 /100 | #156 | Good 5.2% |
| Immigrants | Russia | 69.3 /100 | #157 | Good 5.2% |
| Albanians | 68.3 /100 | #158 | Good 5.2% |
| Immigrants | Micronesia | 66.9 /100 | #159 | Good 5.2% |
| Immigrants | Spain | 66.8 /100 | #160 | Good 5.2% |
| Immigrants | Pakistan | 66.7 /100 | #161 | Good 5.2% |