Somali vs South African Average Family Size
COMPARE
Somali
South African
Average Family Size
Average Family Size Comparison
Somalis
South Africans
3.20
AVERAGE FAMILY SIZE
11.2/ 100
METRIC RATING
214th/ 347
METRIC RANK
3.17
AVERAGE FAMILY SIZE
1.7/ 100
METRIC RATING
253rd/ 347
METRIC RANK
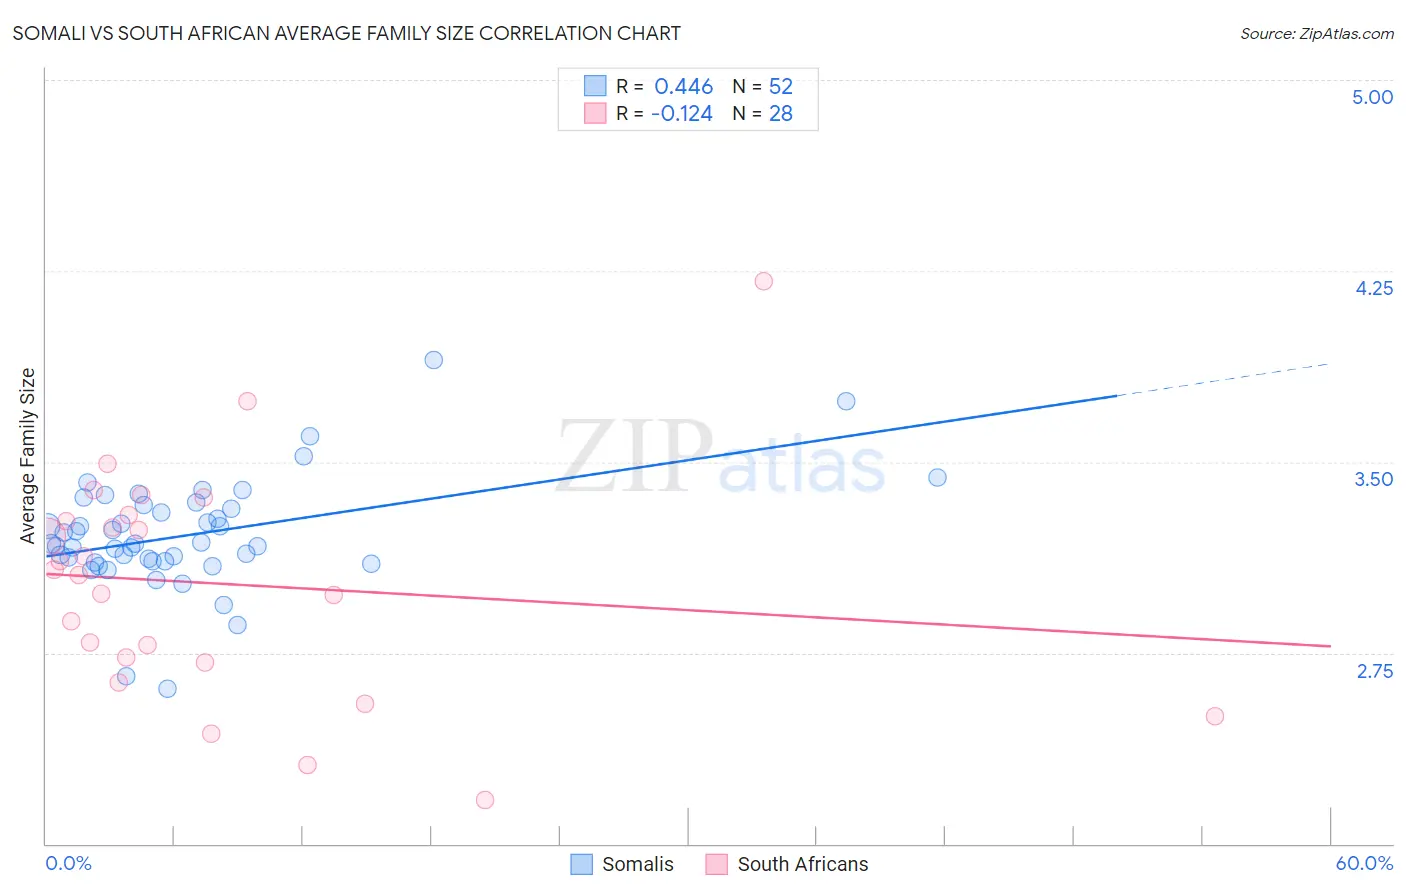
Somali vs South African Average Family Size Correlation Chart
The statistical analysis conducted on geographies consisting of 99,260,153 people shows a moderate positive correlation between the proportion of Somalis and average family size in the United States with a correlation coefficient (R) of 0.446 and weighted average of 3.20. Similarly, the statistical analysis conducted on geographies consisting of 182,542,569 people shows a poor negative correlation between the proportion of South Africans and average family size in the United States with a correlation coefficient (R) of -0.124 and weighted average of 3.17, a difference of 0.92%.
Average Family Size Correlation Summary
| Measurement | Somali | South African |
| Minimum | 2.61 | 2.17 |
| Maximum | 3.90 | 4.21 |
| Range | 1.29 | 2.04 |
| Mean | 3.21 | 3.02 |
| Median | 3.18 | 3.07 |
| Interquartile 25% (IQ1) | 3.11 | 2.72 |
| Interquartile 75% (IQ3) | 3.32 | 3.28 |
| Interquartile Range (IQR) | 0.21 | 0.56 |
| Standard Deviation (Sample) | 0.22 | 0.44 |
| Standard Deviation (Population) | 0.21 | 0.44 |
Similar Demographics by Average Family Size
Demographics Similar to Somalis by Average Family Size
In terms of average family size, the demographic groups most similar to Somalis are Delaware (3.20, a difference of 0.010%), Bermudan (3.20, a difference of 0.010%), Mongolian (3.20, a difference of 0.020%), Immigrants from Iran (3.20, a difference of 0.040%), and Creek (3.20, a difference of 0.040%).
| Demographics | Rating | Rank | Average Family Size |
| Filipinos | 13.6 /100 | #207 | Poor 3.20 |
| Chippewa | 13.3 /100 | #208 | Poor 3.20 |
| Sudanese | 13.3 /100 | #209 | Poor 3.20 |
| Zimbabweans | 12.6 /100 | #210 | Poor 3.20 |
| Immigrants | Iran | 12.1 /100 | #211 | Poor 3.20 |
| Creek | 12.1 /100 | #212 | Poor 3.20 |
| Mongolians | 11.5 /100 | #213 | Poor 3.20 |
| Somalis | 11.2 /100 | #214 | Poor 3.20 |
| Delaware | 11.1 /100 | #215 | Poor 3.20 |
| Bermudans | 11.0 /100 | #216 | Poor 3.20 |
| Immigrants | Somalia | 10.3 /100 | #217 | Poor 3.20 |
| French American Indians | 9.8 /100 | #218 | Tragic 3.20 |
| Pennsylvania Germans | 9.3 /100 | #219 | Tragic 3.19 |
| Lebanese | 9.1 /100 | #220 | Tragic 3.19 |
| Immigrants | Ukraine | 7.2 /100 | #221 | Tragic 3.19 |
Demographics Similar to South Africans by Average Family Size
In terms of average family size, the demographic groups most similar to South Africans are Immigrants from Saudi Arabia (3.17, a difference of 0.0%), Immigrants from Hungary (3.17, a difference of 0.0%), Cape Verdean (3.17, a difference of 0.020%), Immigrants from Spain (3.17, a difference of 0.030%), and Puget Sound Salish (3.17, a difference of 0.040%).
| Demographics | Rating | Rank | Average Family Size |
| Danes | 2.5 /100 | #246 | Tragic 3.17 |
| Cajuns | 2.4 /100 | #247 | Tragic 3.17 |
| Immigrants | Belarus | 2.3 /100 | #248 | Tragic 3.17 |
| Immigrants | Eastern Europe | 2.1 /100 | #249 | Tragic 3.17 |
| Puget Sound Salish | 1.9 /100 | #250 | Tragic 3.17 |
| Immigrants | Spain | 1.8 /100 | #251 | Tragic 3.17 |
| Immigrants | Saudi Arabia | 1.7 /100 | #252 | Tragic 3.17 |
| South Africans | 1.7 /100 | #253 | Tragic 3.17 |
| Immigrants | Hungary | 1.7 /100 | #254 | Tragic 3.17 |
| Cape Verdeans | 1.6 /100 | #255 | Tragic 3.17 |
| Immigrants | Kazakhstan | 1.5 /100 | #256 | Tragic 3.17 |
| Albanians | 1.5 /100 | #257 | Tragic 3.17 |
| Turks | 1.3 /100 | #258 | Tragic 3.16 |
| Potawatomi | 1.3 /100 | #259 | Tragic 3.16 |
| Immigrants | Albania | 1.3 /100 | #260 | Tragic 3.16 |